2024-2025 East Greenwich School Department Financial Overview

Overview and Historical Background

agenda

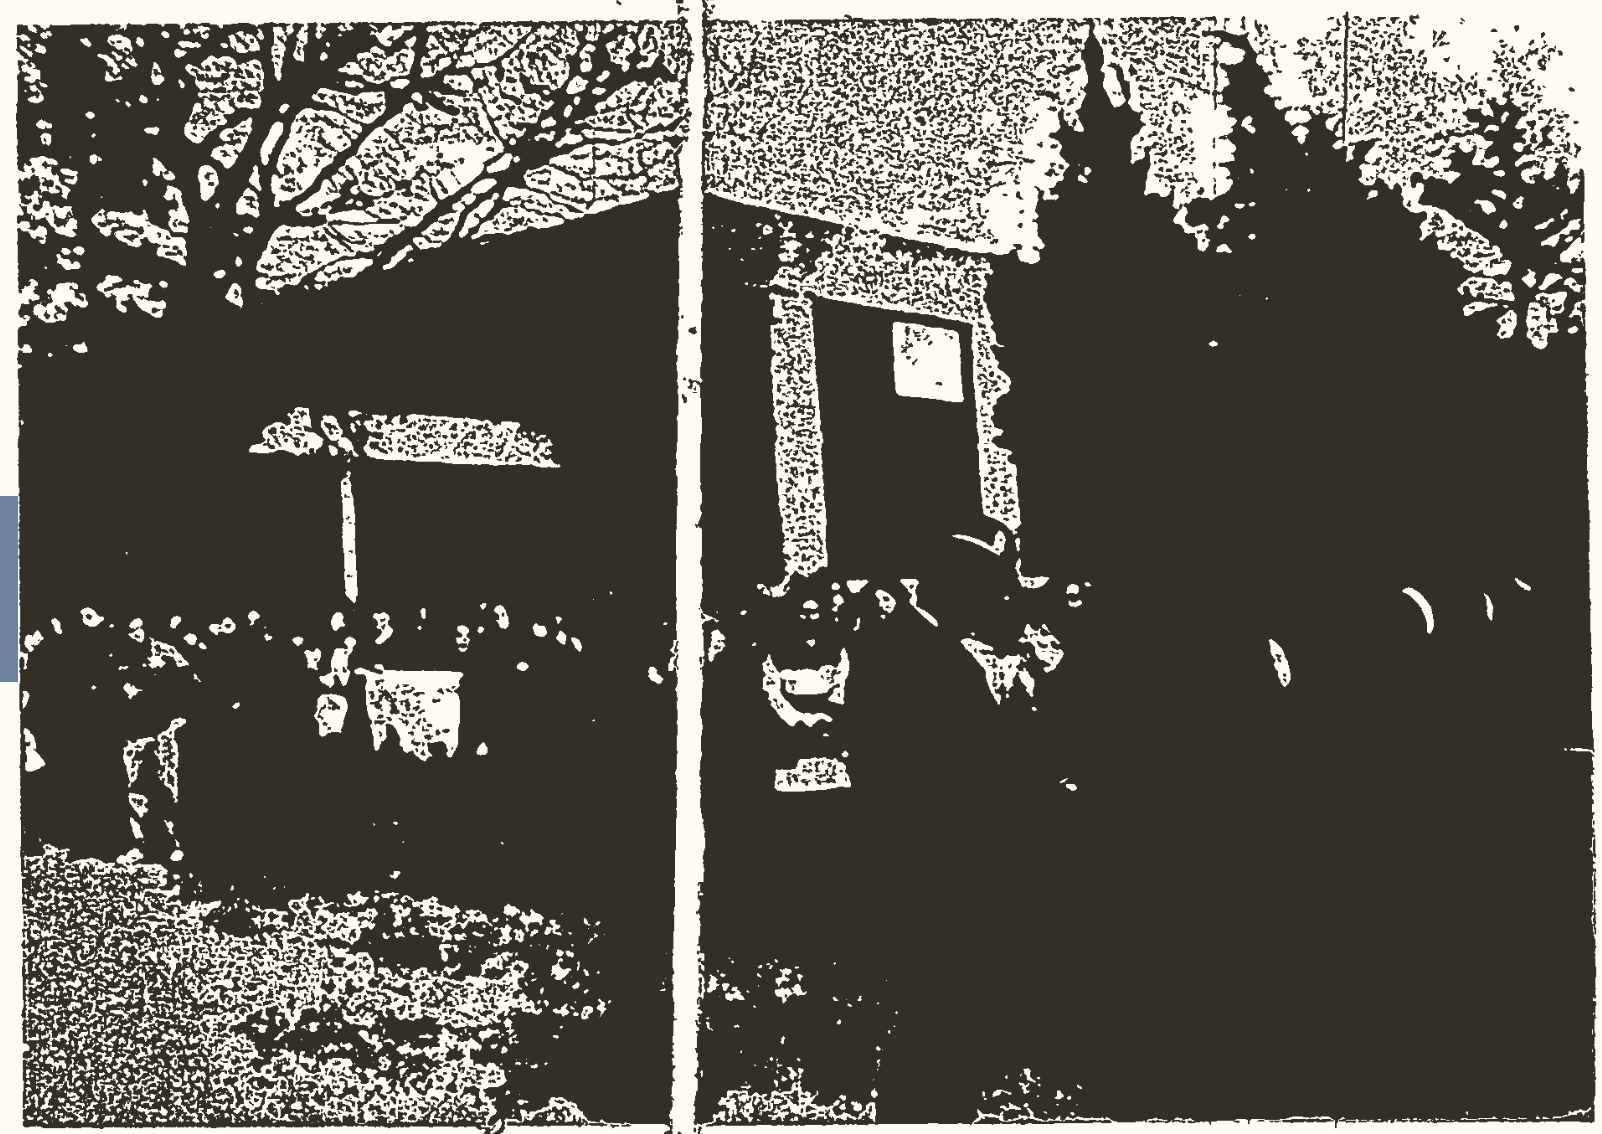
May 4, 1971 EGHS students protesting budget cuts are refused admission to the Financial Town Meeting (East Greenwich Pendulum)

The Data is Telling a Story

agenda

Total Property Tax Levy and School Appropriation History
(click on image to see data)

The Story

agenda

Total Property Tax Levy and School Appropriation History
(click on image to see data)

The long-term, big picture view:

Implications of the Story

core instruction

Story Parameters for Recent Years
click image for larger version

The most recent straight line trajectories for the tax levy and school appropriation have the following properties:

Implications of the Current Trajectory

core instruction

School Appropriation Percentage of Property Tax Levy

Based on the fact that the property tax levy is increasing by $1.8 million per year and the school appropriation is increasing by $813,000 per year, we can say that:

Implications of Straight-Line vs Constant Percentage Change Trajectories

core instruction

School Appropriation: Straight-Line vs Constant Percentage Trajectories

Long Term Forecasting - School Appropriation3

core instruction

13 Year Appropriation Forecast with 95% Credible Intervals
click on image for larger view

Fiscal YearLower 95% BoundExpected AppropriationUpper 95% Bound
2026$40.4$41.8$43.3
2027$41.3$43.1$45.0
2028$42.3$44.4$46.6
2029$43.2$45.7$48.2
2030$44.2$47.0$49.9
2031$45.2$48.3$51.5
2032$46.2$49.7$53.1
2033$47.1$51.0$54.7
2034$48.1$52.2$56.4
2035$49.1$53.6$58.0
2036$50.1$54.9$59.6
2037$51.1$56.2$61.2

Long Term Forecast - Property Tax Levy4

core instruction

Thirteen Year Tax Levy Forecast with 95% Credible Intervals
click image for larger view

Fiscal YearLower 95% BoundExpected LevyUpper 95% Bound
2026$65.4$66.6$67.8
2027$66.5$68.4$70.1
2028$68.0$70.2$72.4
2029$69.5$72.1$74.6
2030$71.0$73.9$76.8
2031$72.5$75.7$79.0
2032$74.0$77.6$81.2
2033$75.5$79.4$83.3
2034$77.0$81.3$85.4
2035$78.5$83.1$87.6
2036$80.0$84.9$89.7
2037$81.6$86.8$91.9
1Plus a noise term with an expected value of zero and a standard deviation of $485,000.
2Plus a noise term with an expected value of zero and a standard deviation of $580,000.
3Predicted values and credible interval bounds are the mean, 2.5th, and 97.5th percentiles of the posterior predictive appropriation distribution. This is a status quo forecast, meaning future debt service impacts have not been factored in. If information about future debt service is available, it can be incorporated by using informative priors.
4Predicted values and credible interval bounds are the mean, 2.5th, and 97.5th percentiles of the posterior predictive levy distribution. This is a status quo forecast, meaning future debt service impacts have not been factored in. If information about future debt service is available, it can be incorporated by using informative priors.