A Century of Residential Real Estate Tax Rates
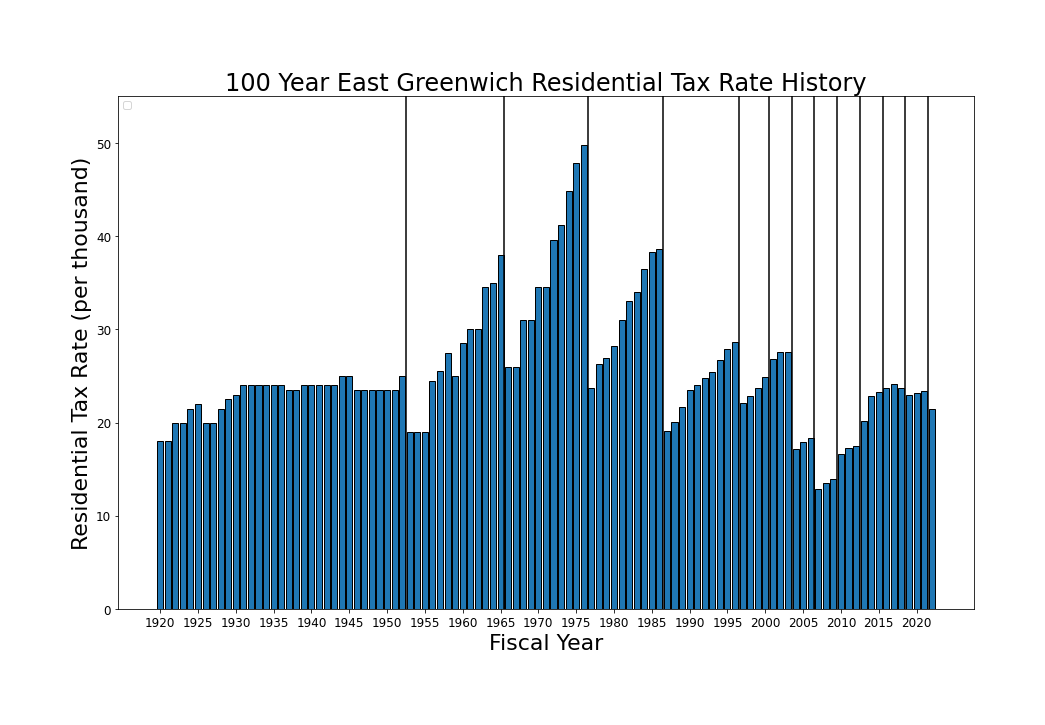
A Century of East Greenwich Residential Tax Rates
-
A first glance at the 100 year tax rate history gives the impression that the tax rate is very volatile,
but 90% of the variation is due to the boom-and-bust real estate market and revaluation cycles.
If you look at the period before the first revaluation in 1952, the tax rate is nearly constant over a 30 year period, which means that nothing that happened during that period had much effect on the tax rate.
This is quite remarkable, because it means none of the following moved the tax rate much:- The latter part of the "Roaring Twenties".
- The 1929 Crash.
- The Great Depression.
- The Second World War.
- The postwar boom.
A Third of a Century of Property Tax Levy History
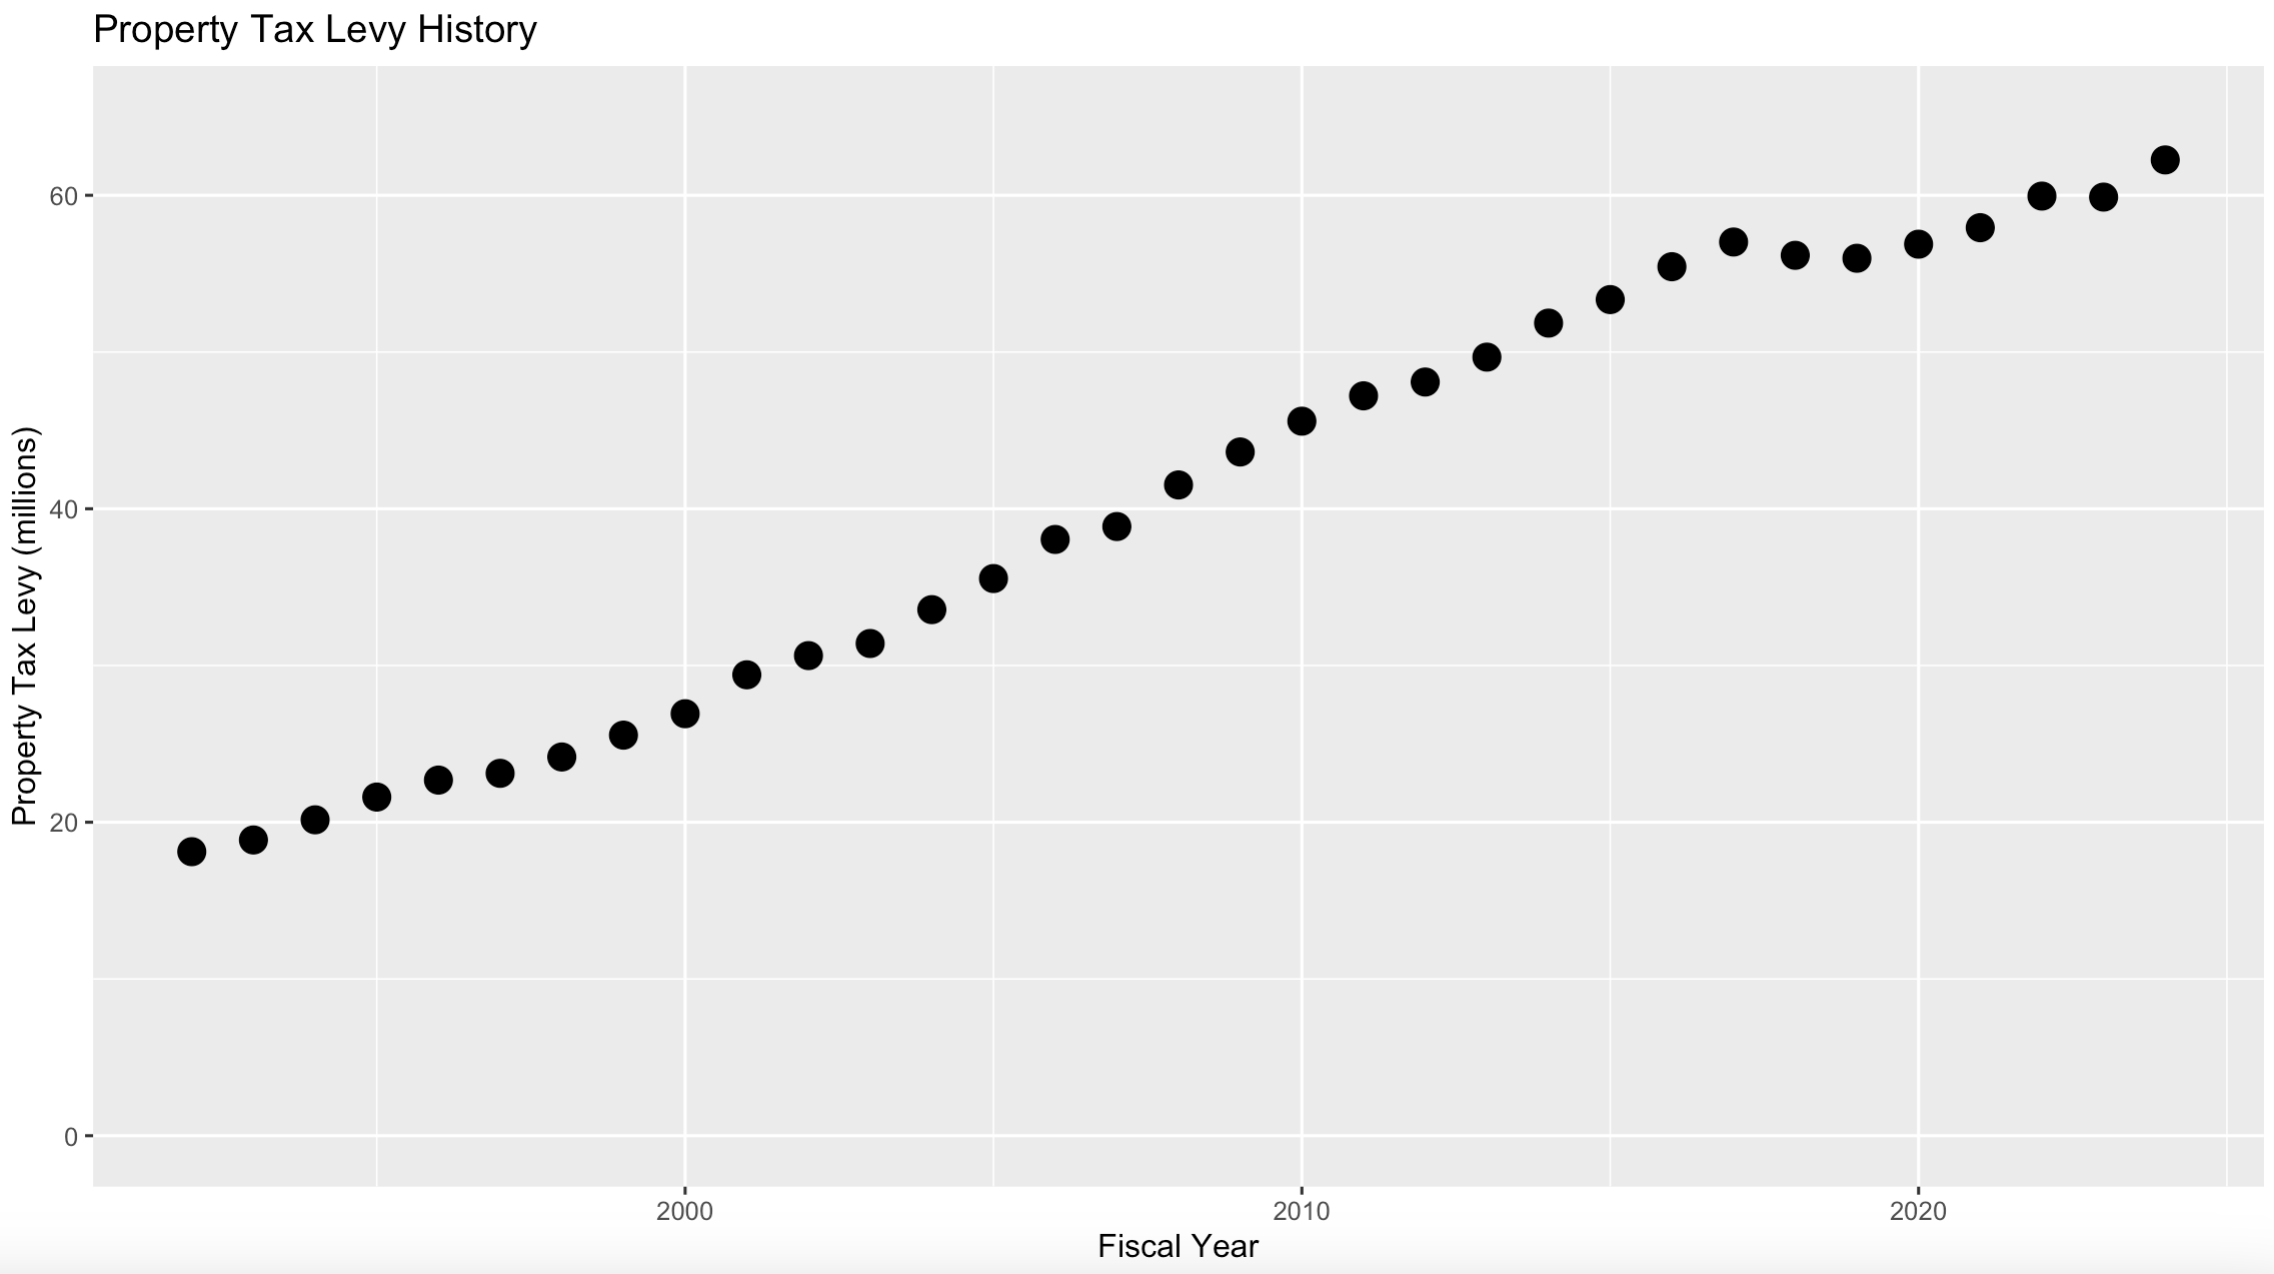
Property Tax Levy: 1992-2024
- Arguably the amount of taxes paid (the tax levy) is more important than the rate.
- Unlike the tax rate, the real estate market and revaluations have little overall effect on the tax levy (the amount of taxes collected).
-
As a result, the property tax levy exhibits considerable stablility, presenting as a straight line with the exception of a few level-funded years. It would be safe to say
that nothing besides level-funding moves the property tax levy off its stable trajectory.
Once again this is quite remarkable, because the 33 year period in the graph contains the following items and events which evidently had little effect on the tax levy:
- 17 Town Council terms.
- 9 School Comittee terms.
- At least 50 collective bargaining agreements.
- Periods when each party had majorities on the Town Council and School Committee.
- Three Town Managers.
- Five School Superintendents.
- Nine revaluation cycles.
- The "dot com" bubble.
- The "Great Recession".
- The 2006 real estate bubble.
- Construction of a new middle school.
- Phase-in of the 4% levy cap.
- Implementation of all-day kindergarten.
- Incorporation of the Fire District.
- Varying levels of inflation.
Implications for Forecasting
Total Property Tax Levy 1992-2024
When constructing a forecast from this model:
- The expected value of future levies is completely determined by the 'signal' part of the model. This is because the 'noise' is assumed to have expected value zero.
- The 'noise' part of the model determines the precision of the forecast values. It does not increase or decrease them.