| Fiscal Year | Residential | Commercial | Tangible | Motor Vehicles | Town Total | Fire District2 | Total |
|---|---|---|---|---|---|---|---|
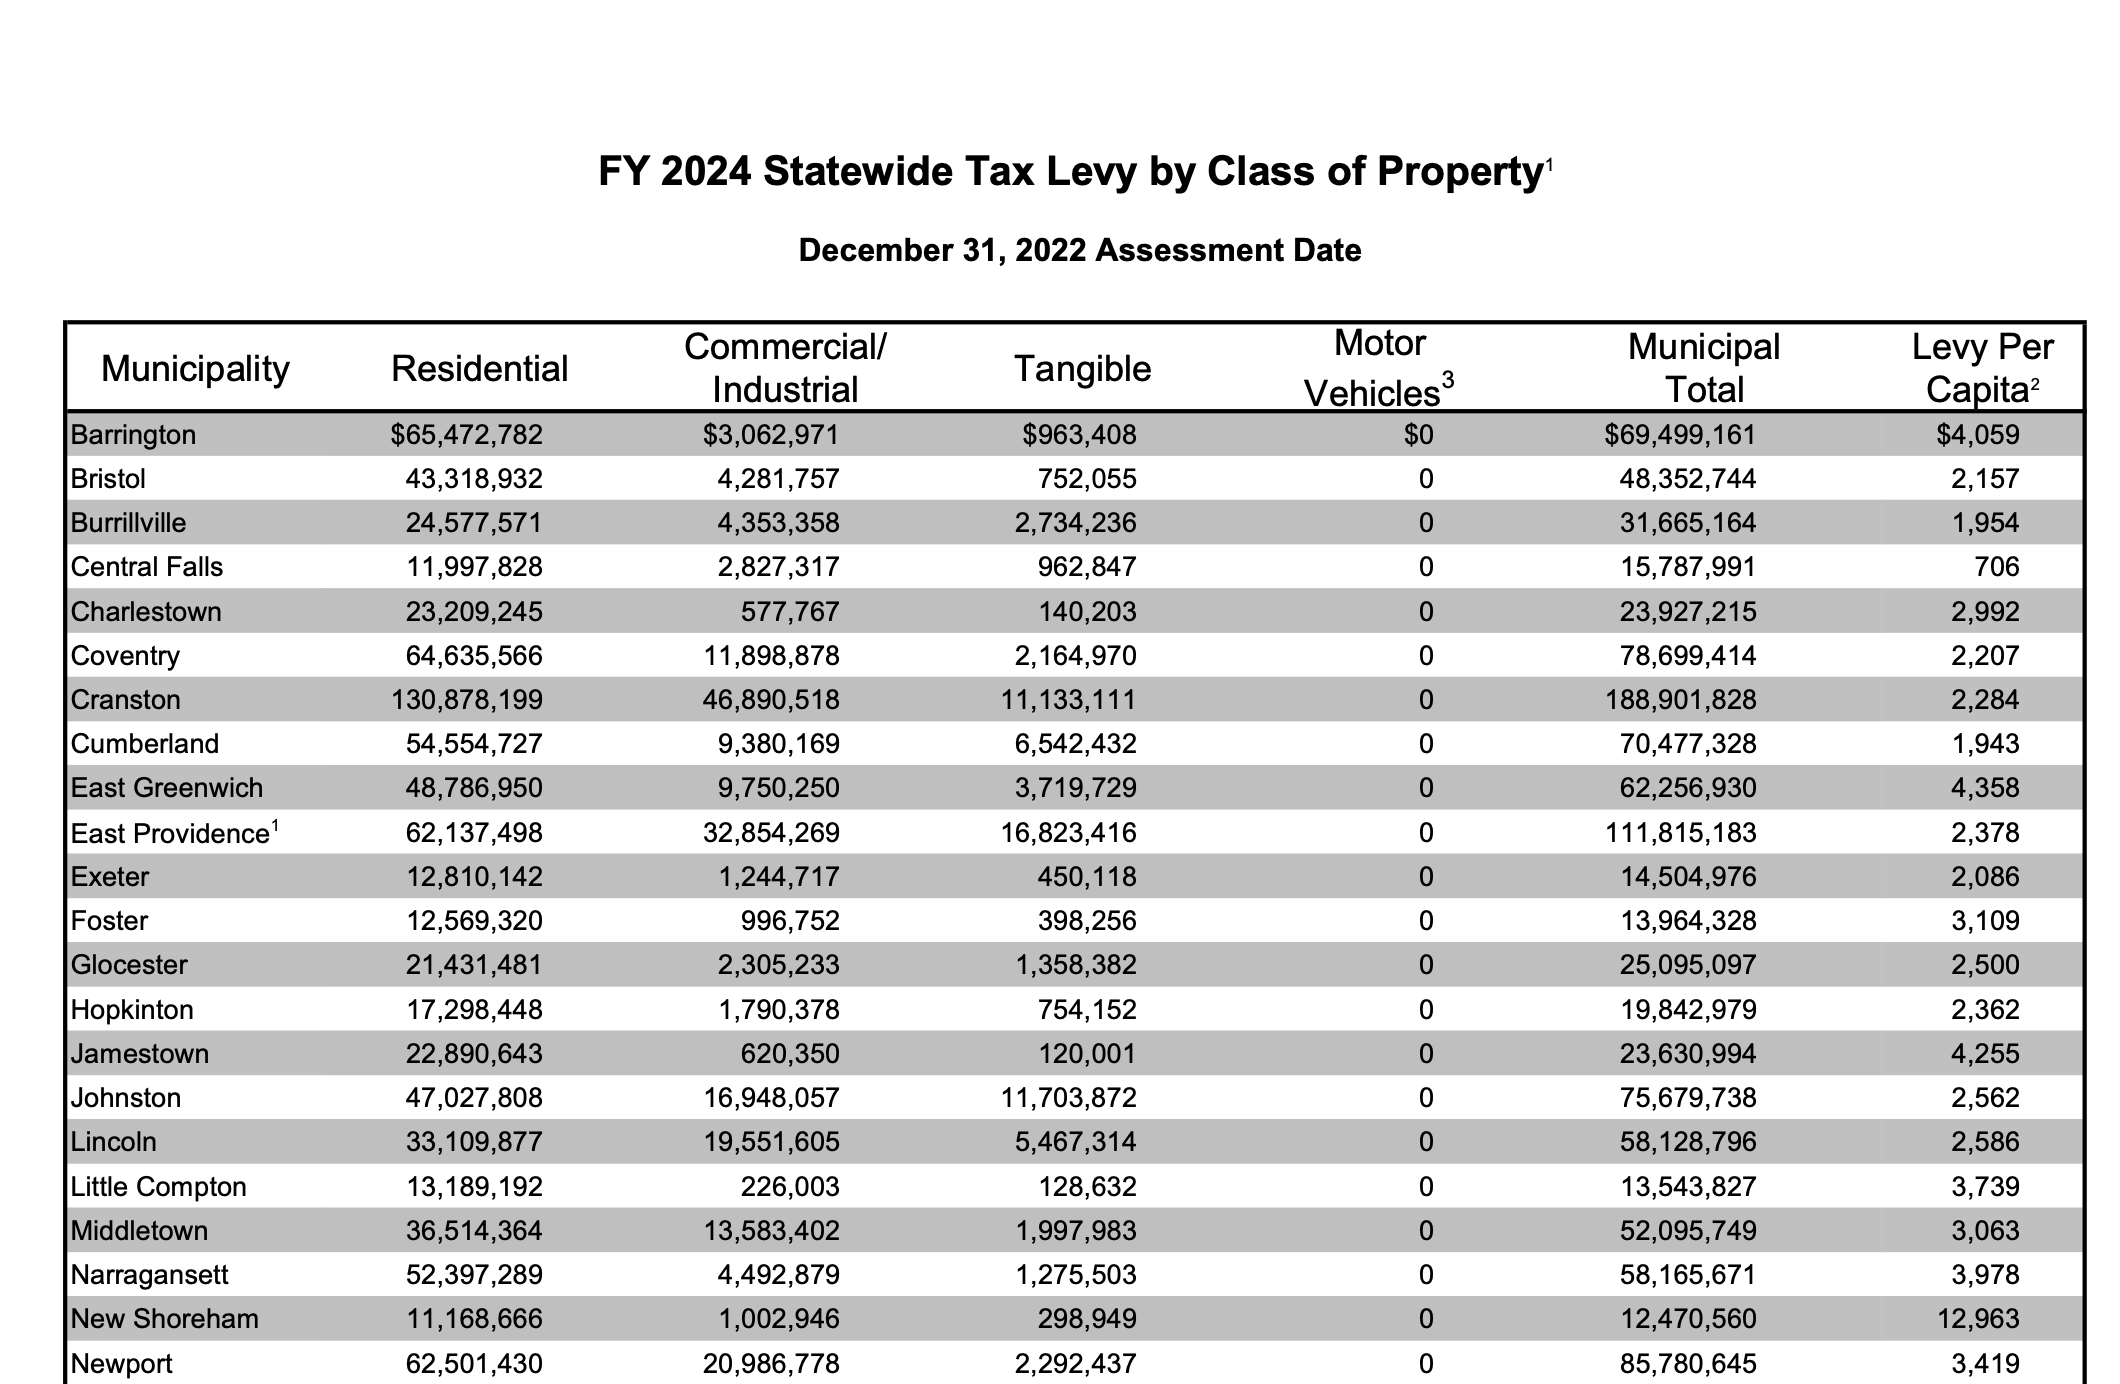
| 2024 | $48,786,950 | $9,750,250 | $3,719,729 | $0 | $62,256,930 | $0 | $62,256,930 |
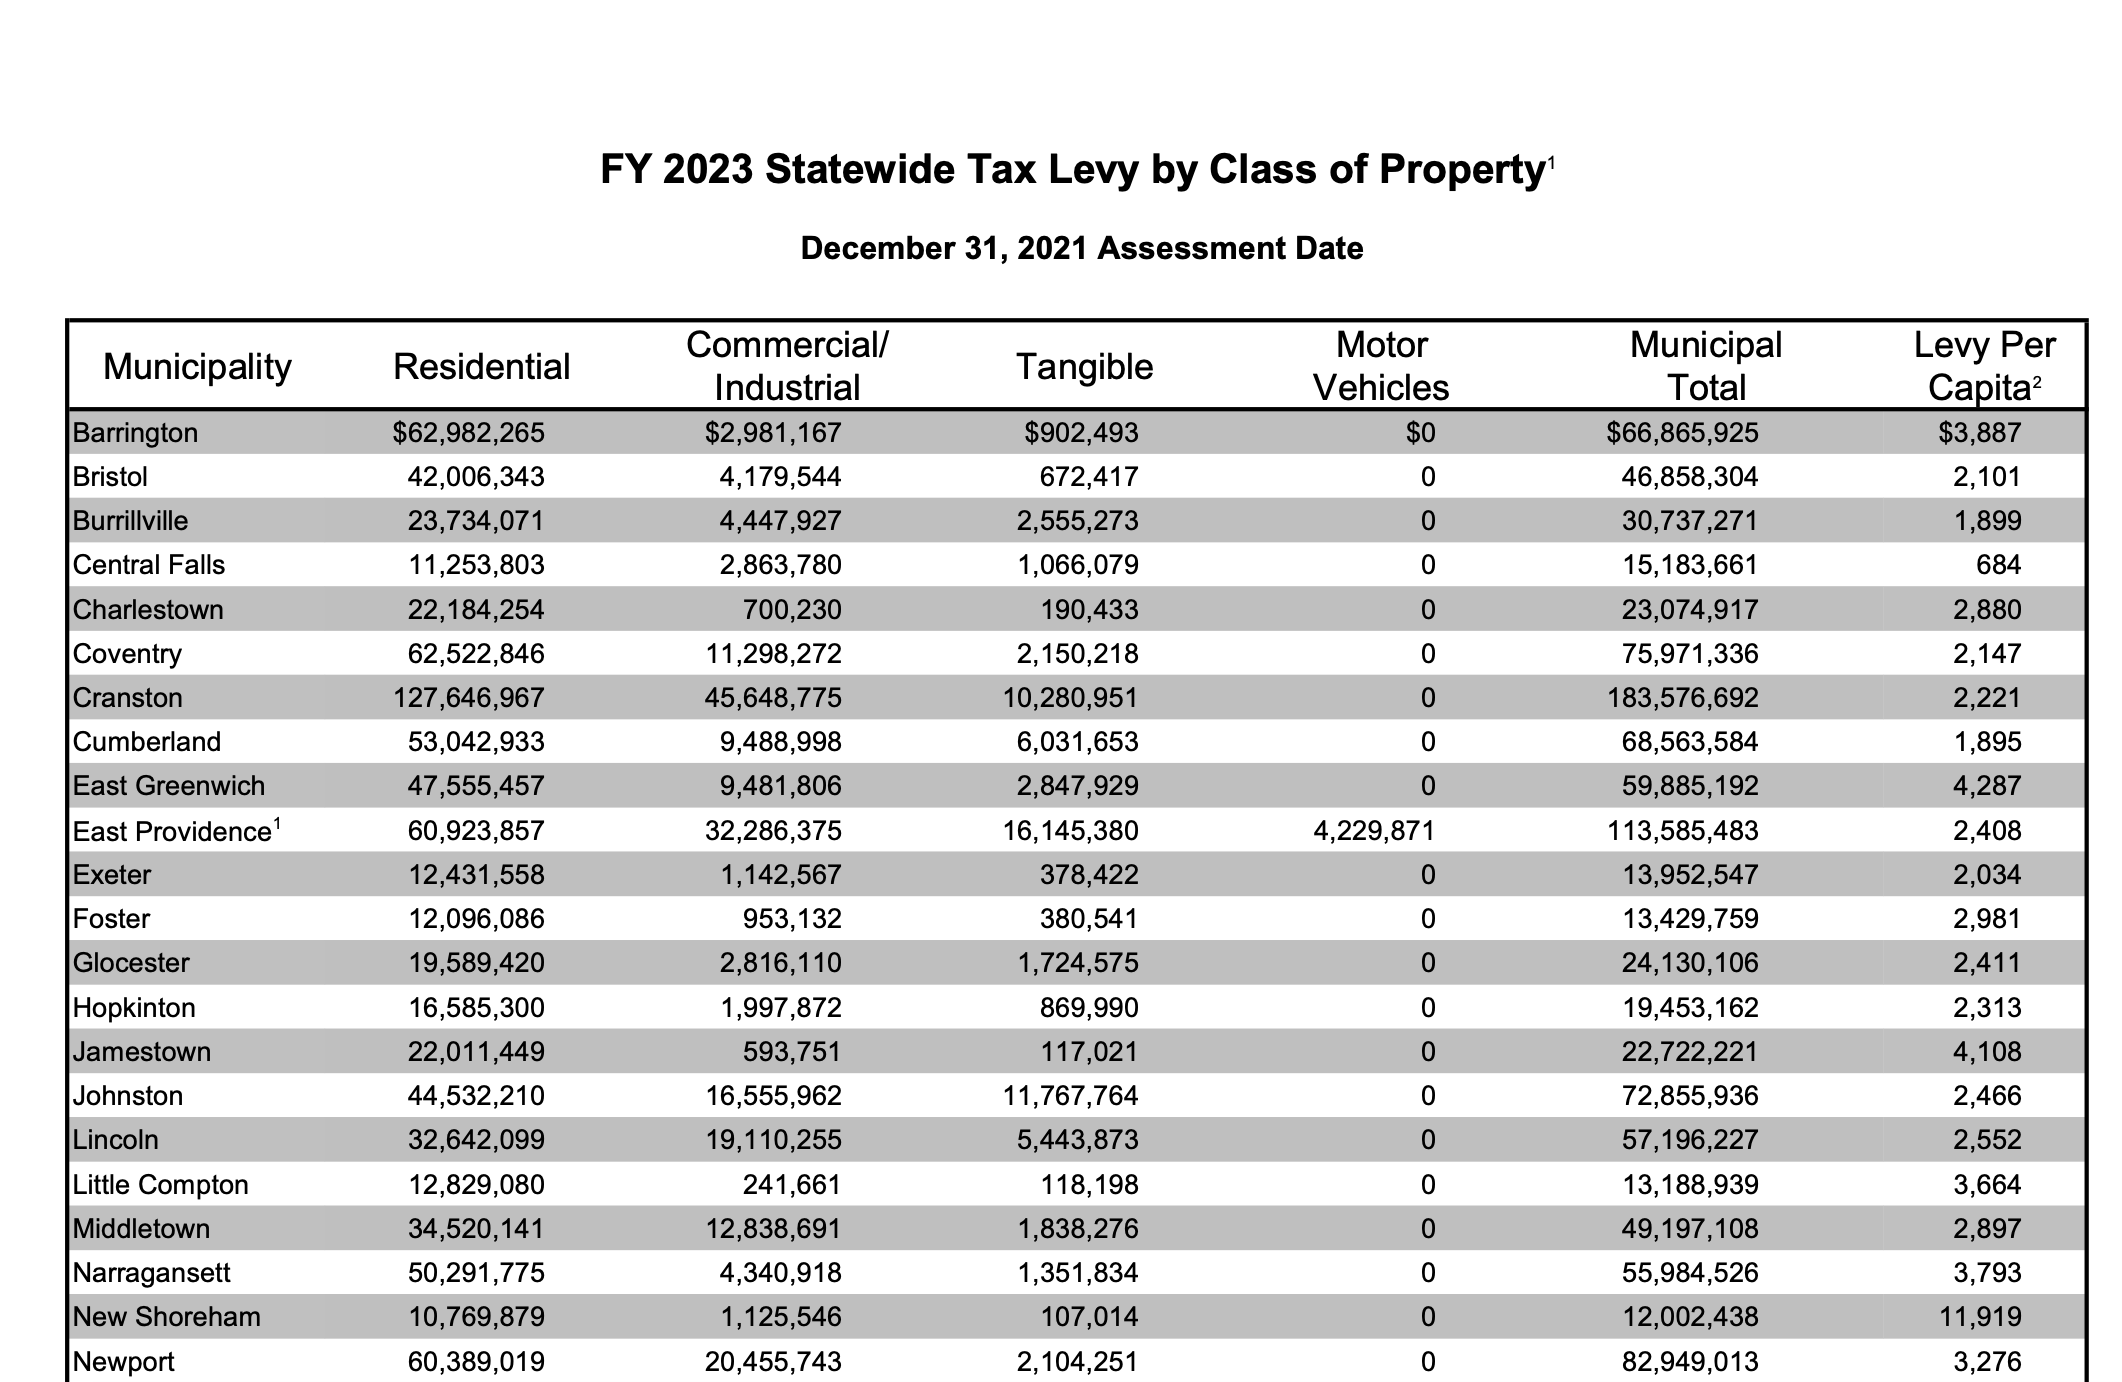
| 2023 | $47,555,457 | $9,481,806 | $2,847,929 | $0 | $59,885,192 | $0 | $59,885,192 |
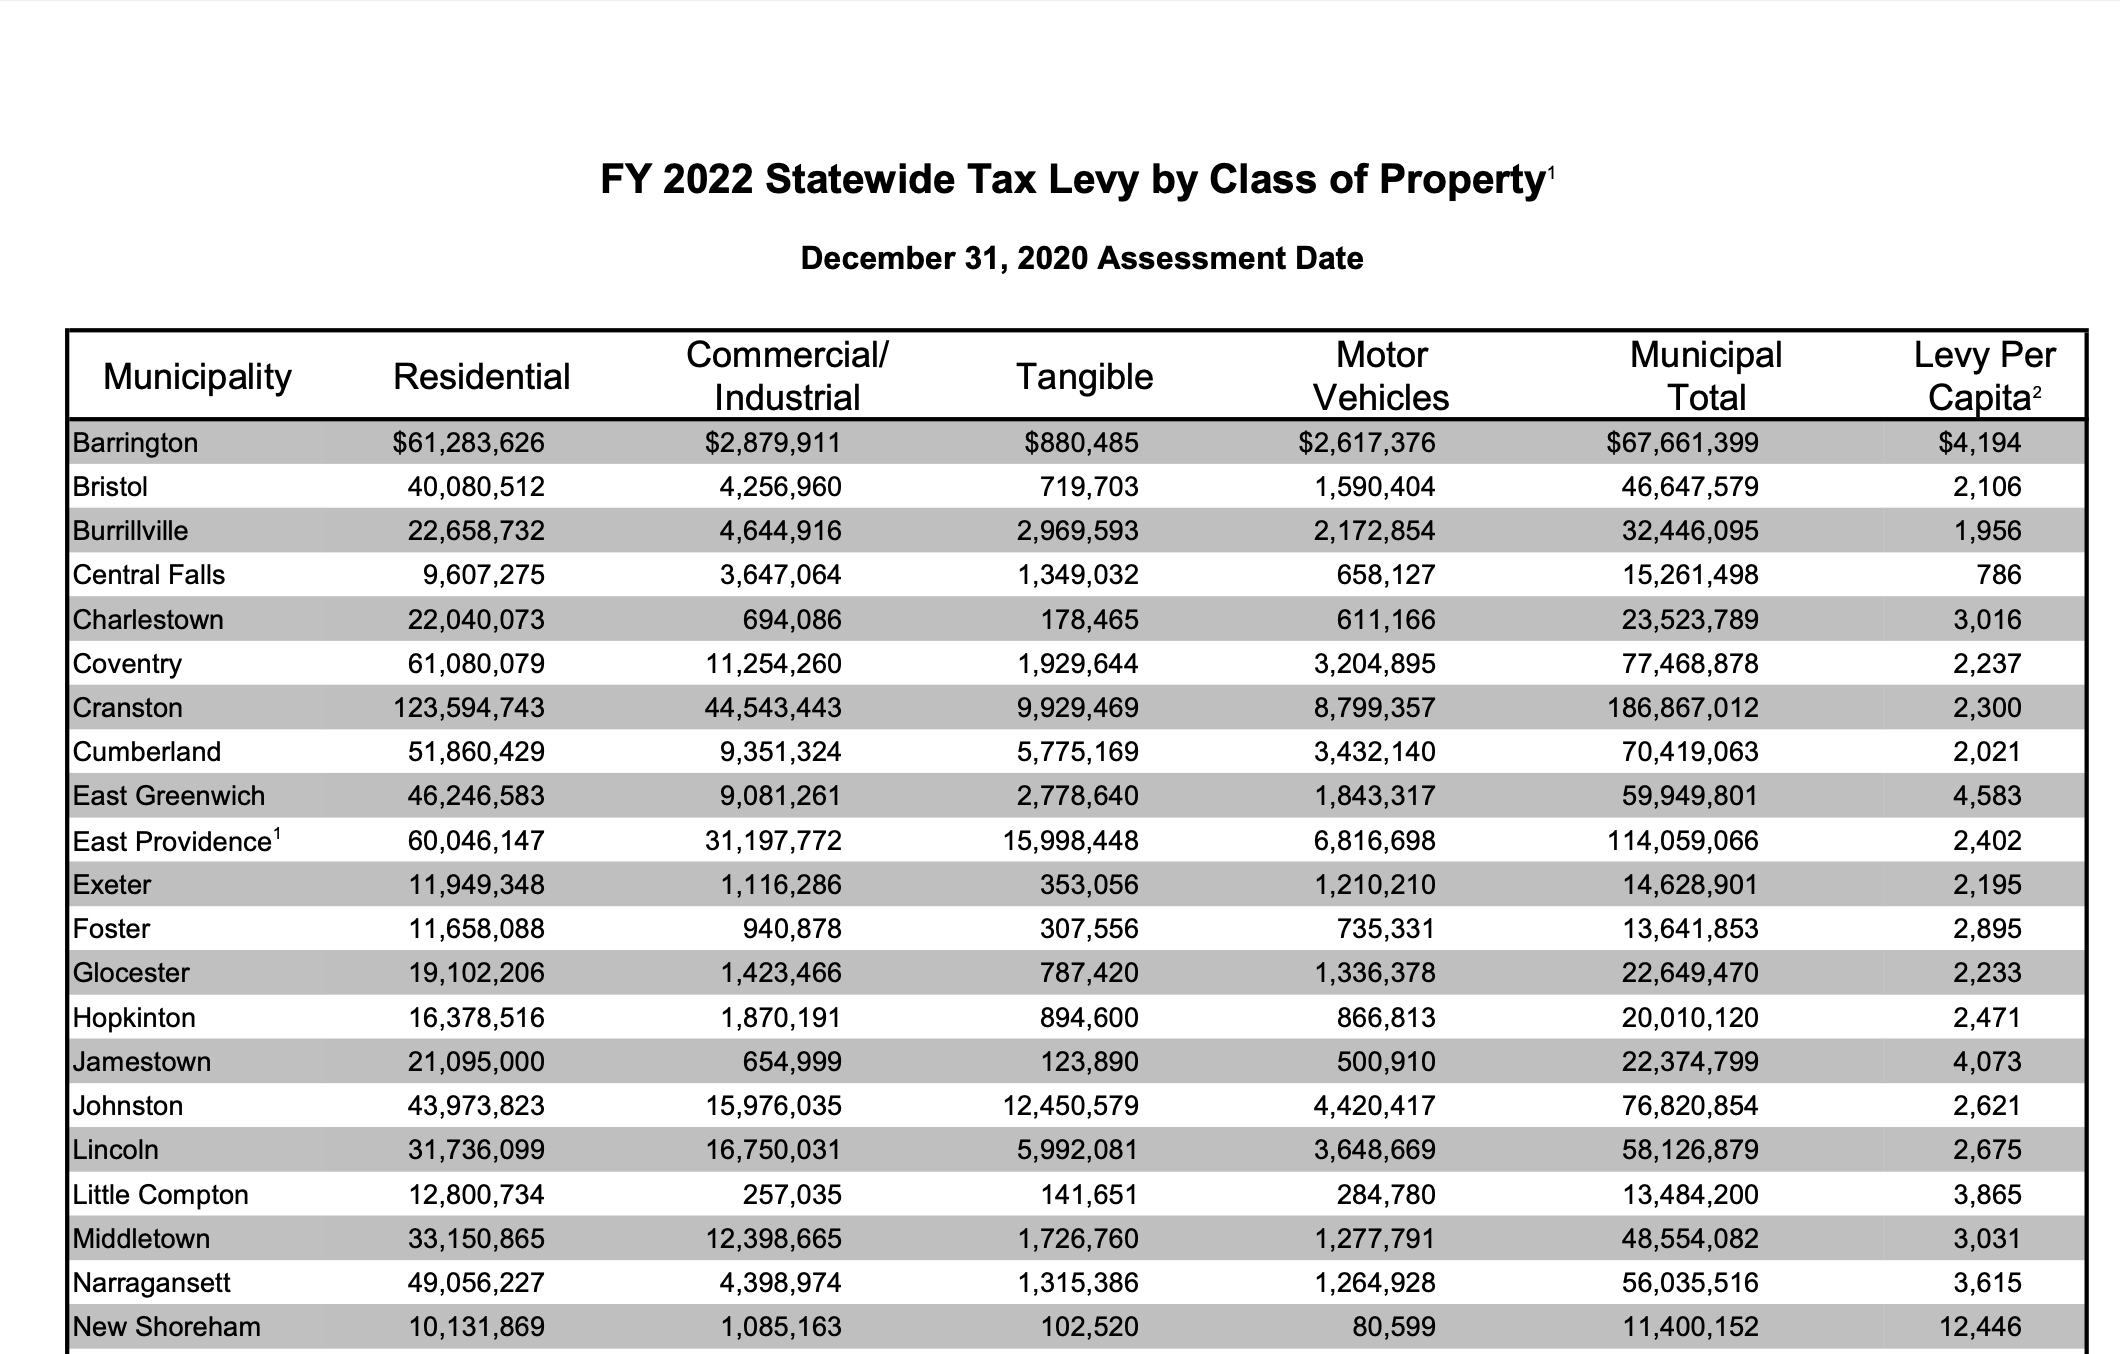
| 2022 | $46,246,583 | $9,081,261 | $2,778,640 | $1,843,317 | $59,949,801 | $0 | $59,949,801 |
| 2021 | $45,656,175 | $8,278,765 | $2,340,174 | $1,658,664 | $57,933,778 | $0 | $57,933,778 |
| 2020 | $45,006,284 | $8,095,127 | $1,886,268 | $1,892,518 | $56,880,197 | $0 | $56,880,197 |
| 2019 | $44,462,455 | $7,742,925 | $1,788,008 | $1,988,520 | $55,981,907 | $0 | $55,981,907 |
| 2018 | $44,685,332 | $7,520,322 | $1,832,569 | $2,131,688 | $56,169,911 | $0 | $56,169,911 |
| 2017 | $45,348,786 | $7,514,025 | $1,860,198 | $2,296,400 | $57,019,409 | $0 | $57,019,409 |
| 2016 | $44,287,782 | $7,192,620 | $1,756,159 | $2,207,241 | $55,443,802 | $0 | $55,443,802 |
| 2015 | $42,434,200 | $7,722,843 | $3,835,295 | $5,337,383 | $53,345,608 | $0 | $53,345,608 |
| 2014 | $40,497,596 | $7,753,516 | $1,438,782 | $2,155,895 | $51,845,789 | $0 | $51,845,789 |
| 2013 | $35,184,469 | $6,786,750 | $1,250,858 | $2,159,050 | $45,381,128 | $4,293,917 | $49,675,045 |
| 2012 | $34,495,142 | $6,503,514 | $1,011,699 | $2,005,496 | $44,015,850 | $4,070,233 | $48,086,083 |
| 2011 | $34,432,569 | $5,804,508 | $1,015,123 | $1,893,170 | $43,145,369 | $4,060,355 | $47,205,724 |
| 2010 | $38,683,194 | $0 | $1,113,204 | $1,727,945 | $41,524,344 | $4,063,744 | $45,588,088 |
| 2009 | $36,678,666 | $0 | $849,641 | $2,048,100 | $39,575,719 | $4,047,972 | $43,623,691 |
| 2008 | $35,012,906 | $0 | $798,199 | $1,913,361 | $37,726,180 | $3,794,238 | $41,520,518 |
| 2007 | $32,626,885 | $0 | $742,267 | $1,940,010 | $35,309,164 | $3,556,219 | $38,865,383 |
| 2006 | $31,846,437 | $0 | $808,585 | $2,036,138 | $34,691,160 | $3,351,209 | $38,042,369 |
| 2005 | $30,159,566 | $0 | $744,899 | $1,838,149 | $32,742,615 | $2,805,045 | $35,547,660 |
| 2004 | $28,383,952 | $0 | $779,245 | $1,871,633 | $31,034,832 | $2,529,042 | $33,563,874 |
| 2003 | $26,253,016 | $0 | $1,062,289 | $1,773,073 | $29,087,640 | $2,316,361 | $31,404,001 |
| 2002 | $25,570,387 | $0 | $994,160 | $1,931,657 | $28,495,352 | $2,135,511 | $30,630,863 |
| 2001 | $21,756,888 | $2,547,585 | $1,029,818 | $1,944,860 | $27,280,262 | $2,125,989 | $29,406,251 |
| 2000 | $21,498,483 | $0 | $1,029,818 | $2,393,850 | $24,831,179 | $2,092,234 | $26,923,413 |
| 1999 | $20,549,044 | $0 | $909,650 | $2,144,695 | $23,601,647 | $1,954,908 | $25,556,555 |
| 1998 | $19,398,393 | $0 | $880,373 | $2,794,198 | $22,193,962 | $1,969,507 | $24,163,469 |
| 1997 | $18,554,222 | $0 | $911,223 | $1,770,701 | $21,236,148 | $1,885,140 | $23,121,288 |
| 1996 | $17,774,975 | $0 | $997,148 | $2,091,833 | $20,863,957 | $1,825,068 | $22,689,025 |
| 1995 | $16,933,312 | $0 | $894,907 | $1,968,679 | $19,857,249 | $1,748,748 | $21,605,997 |
| 1994 | $16,113,939 | $0 | $850,989 | $1,660,867 | $18,625,795 | $1,528,837 | $20,154,632 |
| 1993 | $15,141,908 | $0 | $786,049 | $1,444,170 | $17,372,127 | $1,496,118 | $18,868,245 |
| 1992 | $14,591,408 | $0 | $736,076 | $1,435,531 | $16,763,016 | $1,358,257 | $18,121,363 |
| 1 | The property tax levy was obtained from the RI Division of Municipal Finance, Department of Revenue Assesed Values and Levies page for fiscal years 2011-2024. Earlier years were obtained from the Tax Roll Recapitulation Page documents filed by the Tax Assessor. |
| 2 | The Fire District levy was obtained from the real estate tax rolls for years when it appeared on them. For other years, the levy was computed by applying the Fire District tax rate obtained from the town clerk to the tax roll account by account, including exemptions. |