East Greenwich School Appropriation and Property Tax Levy History
School Appropriation History Detail1
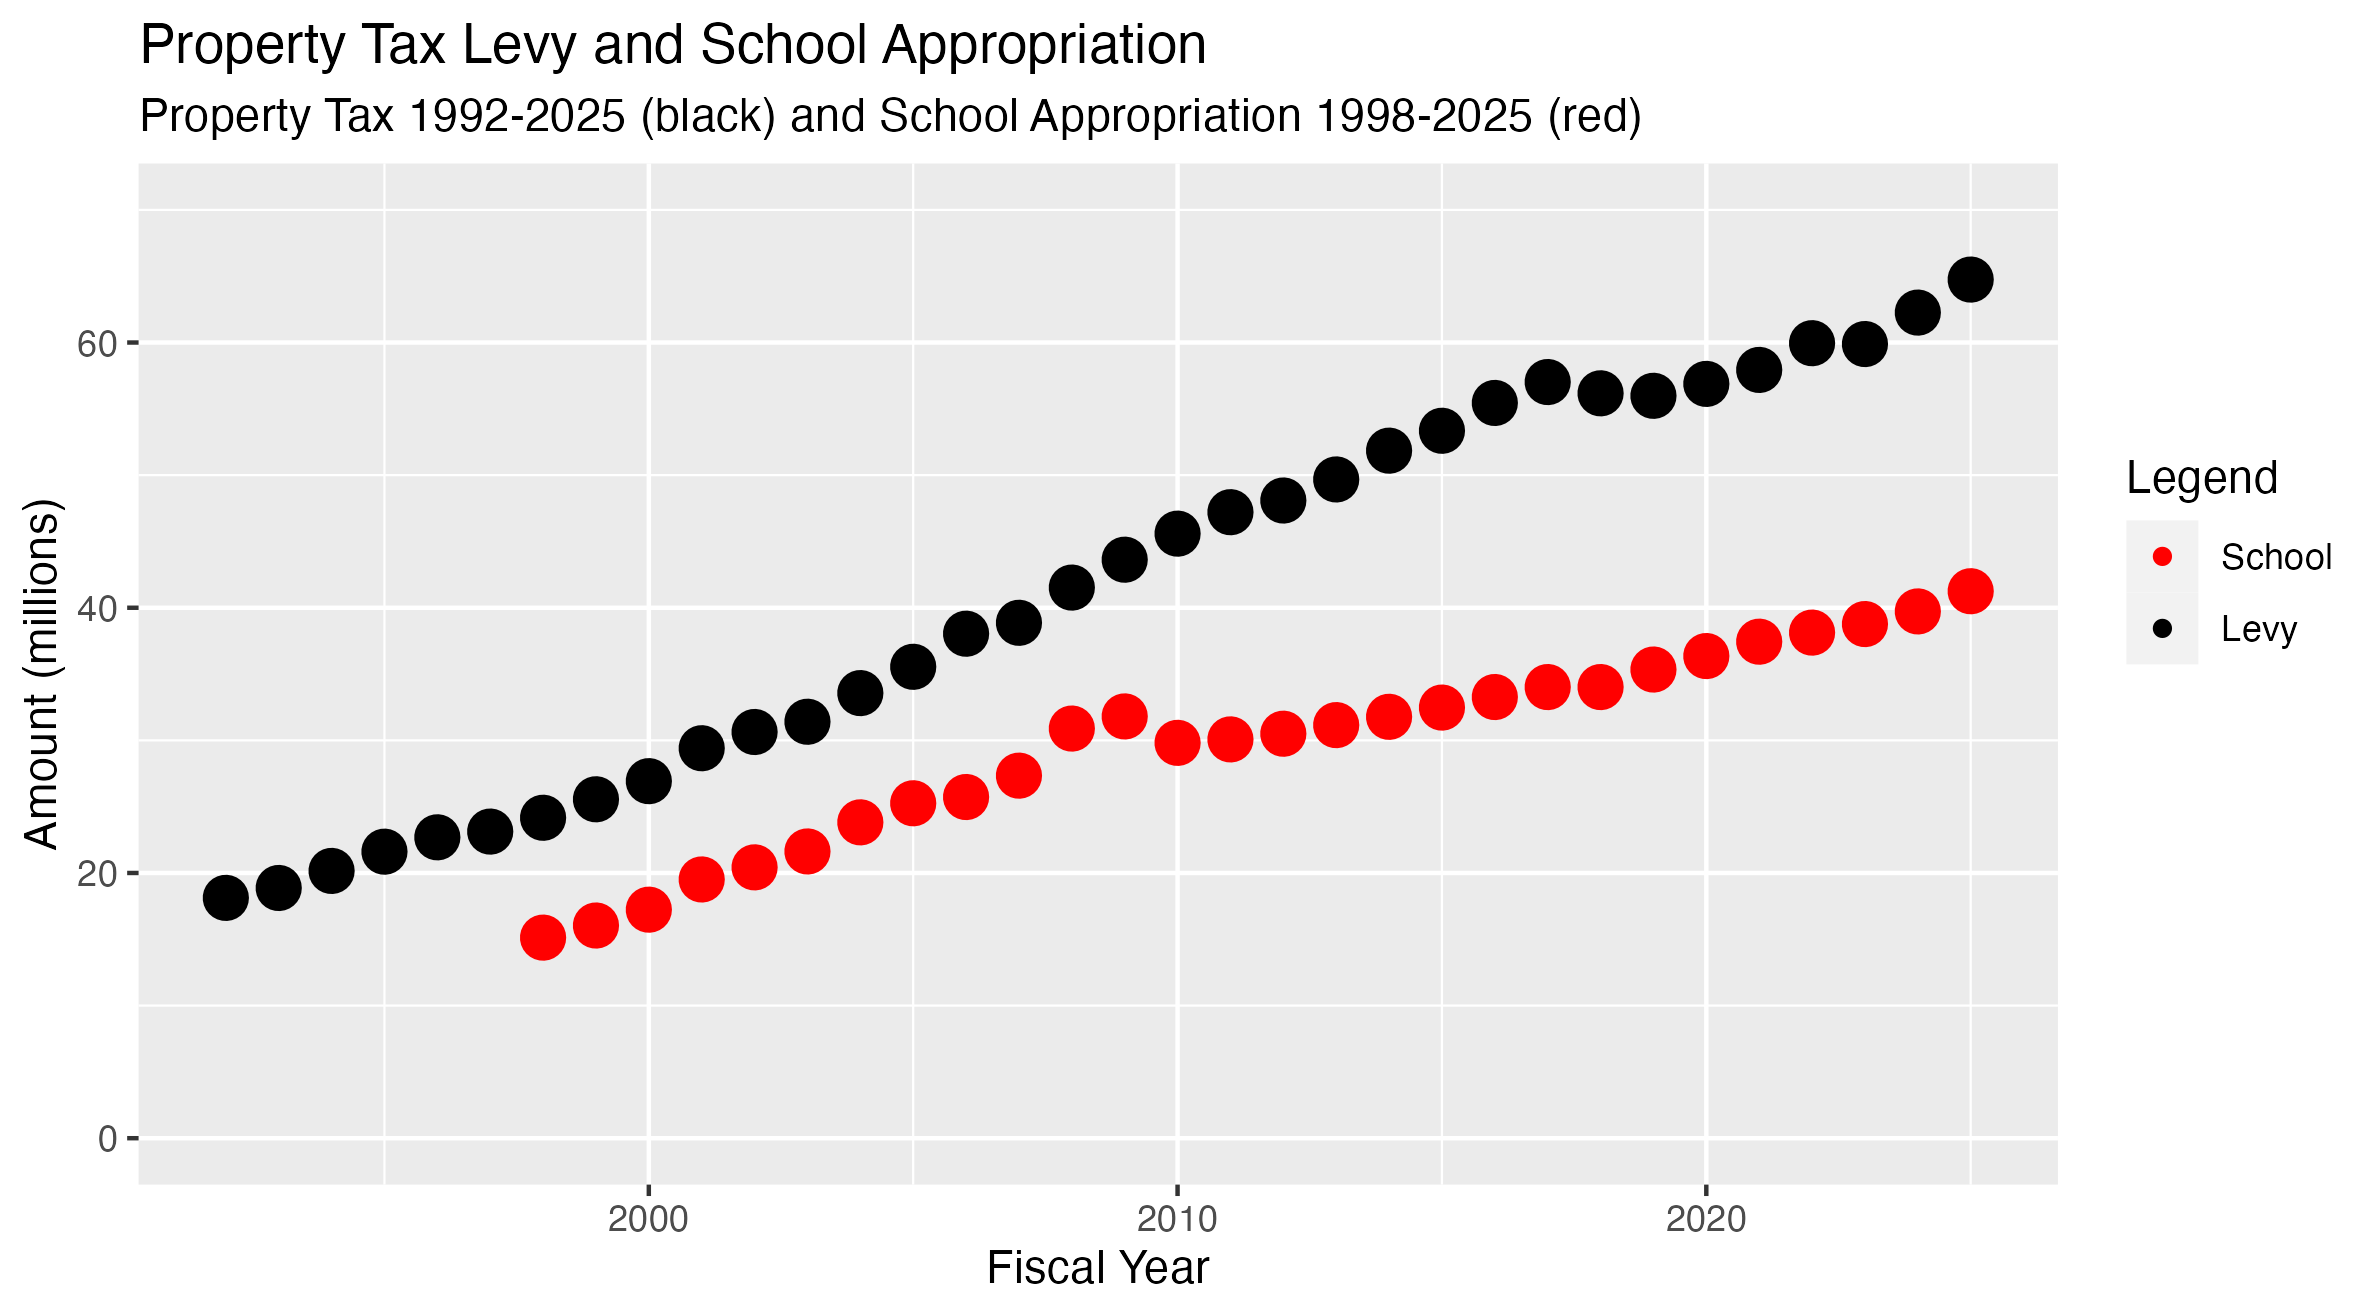
- The school appropriation history covers 28 school years from 1997-1998 to 2024-2025.
| School Year | School Appropriation | Change from Previous Year |
|---|---|---|
| 2024-20252 | $41,312,372 | $1,589,372 |
| 2023-2024 | $39,723,000 | $953,000 |
| 2022-2023 | $38,770,000 | $644,000 |
| 2021-2022 | $38,126,000 | $685,000 |
| 2020-2021 | $37,441,000 | $1,084,000 |
| 2019-2020 | $36,358,000 | $1,017,000 |
| 2018-2019 | $35,341,000 | $1,321,000 |
| 2017-20183 | $34,019,000 | $0 |
| 2016-2017 | $34,019,000 | $751,000 |
| 2015-2016 | $33,267,000 | $795,000 |
| 2014-2015 | $32,472,000 | $695,000 |
| 2013-2014 | $31,776,000 | $626,000 |
| 2012-2013 | $31,150,000 | $649,000 |
| 2011-2012 | $30,501,000 | $428,560 |
| 2010-2011 | $30,073,000 | $260,172 |
| 2009-20104 | $29,812,000 | -$1,993,000 |
| 2008-2009 | $31,805,000 | $915,000 |
| 2007-20085 | $30,890,000 | $3,551,000 |
| 2006-2007 | $27,339,000 | $1,612,000 |
| 2005-2006 | $25,727,000 | $471,000 |
| 2004-2005 | $25,256,000 | $1,438,000 |
| 2003-2004 | $23,818,000 | $2,196,000 |
| 2002-2003 | $21,622,000 | $1,198,000 |
| 2001-2002 | $20,424,000 | $913,000 |
| 2000-2001 | $19,511,000 | $2,278,000 |
| 1999-2000 | $17,233,000 | $1,195,000 |
| 1998-1999 | $16,038,000 | $913,000 |
| 1997-1998 | $15,125,000 |
References and Footnotes
| 1 | The School Appropriation was obtained from the Town Manager's proposed budget for 2024-2025, from town financial records for 2022-2023 and 2023-2024, from RI Dept of Education Uniform Chart of Accounts data for 2010-2011 through 2012-2022, and from the National Center for Education Statistics Elementary/Secondary Information System for 1997-1998 through 2009-2010. |
| 2 | Town Council approved. |
| 3 | Motivated by a combination of deeply flawed analytics and confirmation bias, the Town Council level-funded the school department for the 2017-2018 school year. These unsustainable cuts threatened our accreditation until the present Town Council provided a $385,000 supplemental appropriation that allowed us to hire a high school librarian. That year Barrington requested and received and exemption and increased their property tax levy by 9.1% . |
| 4 | The Maintenance of Effort requirement, which states that the school appropriation cannot be lower than the previous years, was relaxed for the 2009-2010 school year. East Greenwich was one of four districts who actually did have a lower appropriation, and East Greenwich alone made the largest possible reduction. |
| 5 | State Aid for the 2007-2008 school year was cut in half for all districts. East Greenwich made up the difference from local property taxes. |
East Greenwich Property Tax Levy History
Property Tax Levy History Detail1
- The property tax history covers 34 years from 1992 to 2025. The 2025 numbers are from the Town Manager's proposed budget.
-
In any given year, there may be taxes from the following sources:
- Residential real estate
- Commercial real estate
- Personal property
- Motor vehicles
- Inventory (combined with personal property in the table below)
- Fire District
- Over time, the composition of the total levy with respect to these categories changes. Looking at the grand total removes most of the variation that results from these changes.
| Fiscal Year | Residential | Commercial | Tangible | Motor Vehicles | Town Total | Fire District2 | Total |
|---|---|---|---|---|---|---|---|
| 20253 | $48,516,398 | $11,432,109 | $4,798,314 | $0 | $64,746,821 | $0 | $64,746,821 |
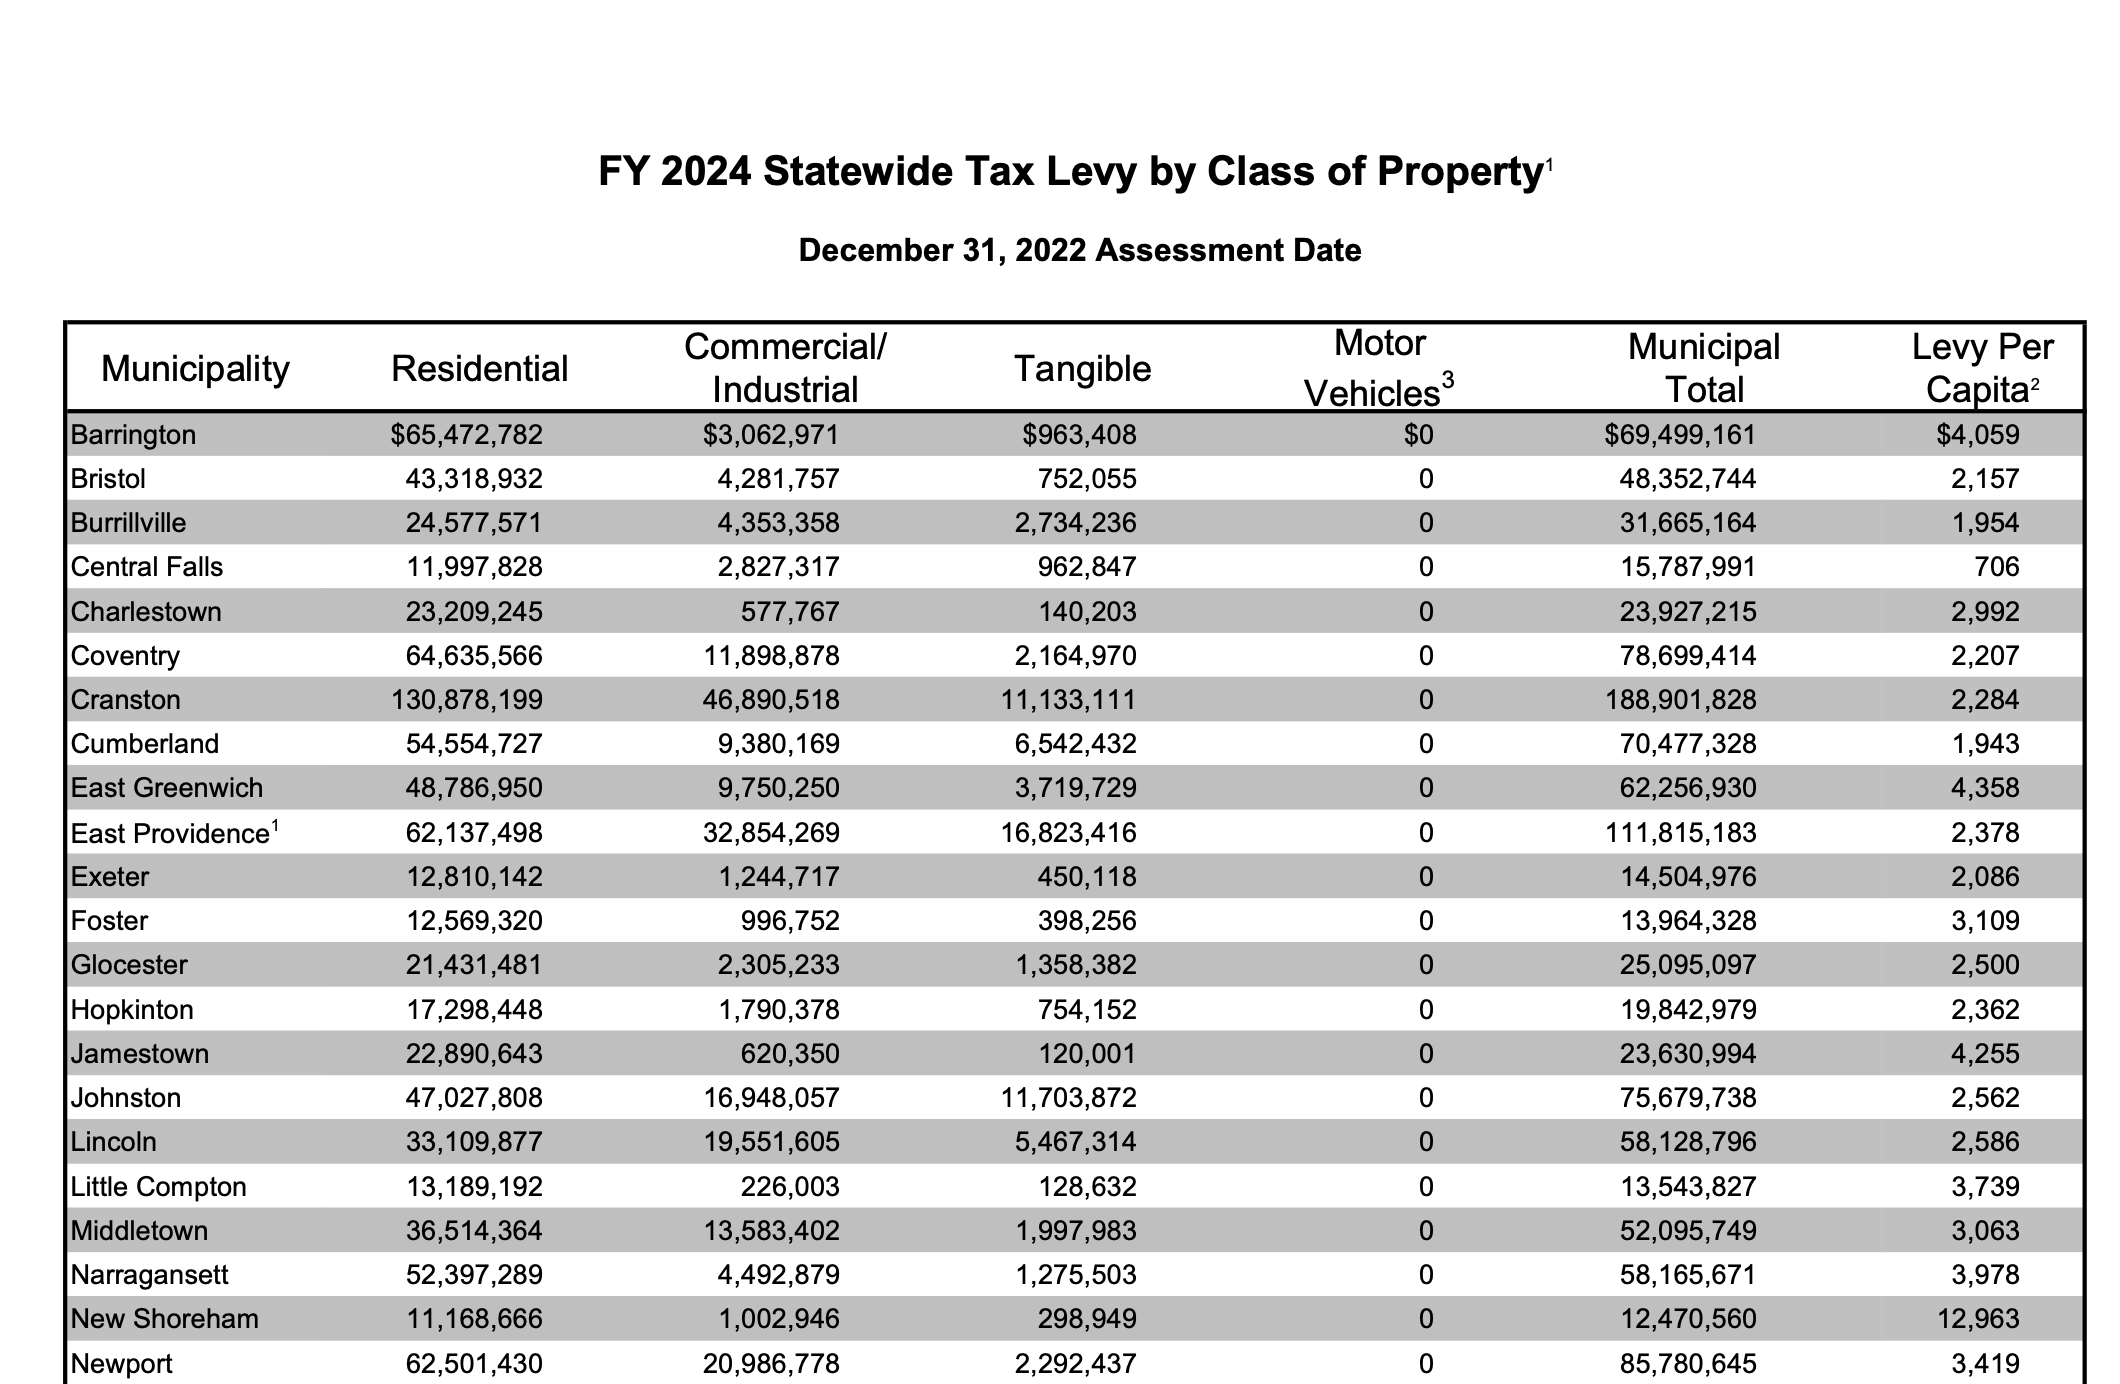
| 2024 | $48,786,950 | $9,750,250 | $3,719,729 | $0 | $62,256,930 | $0 | $62,256,930 |
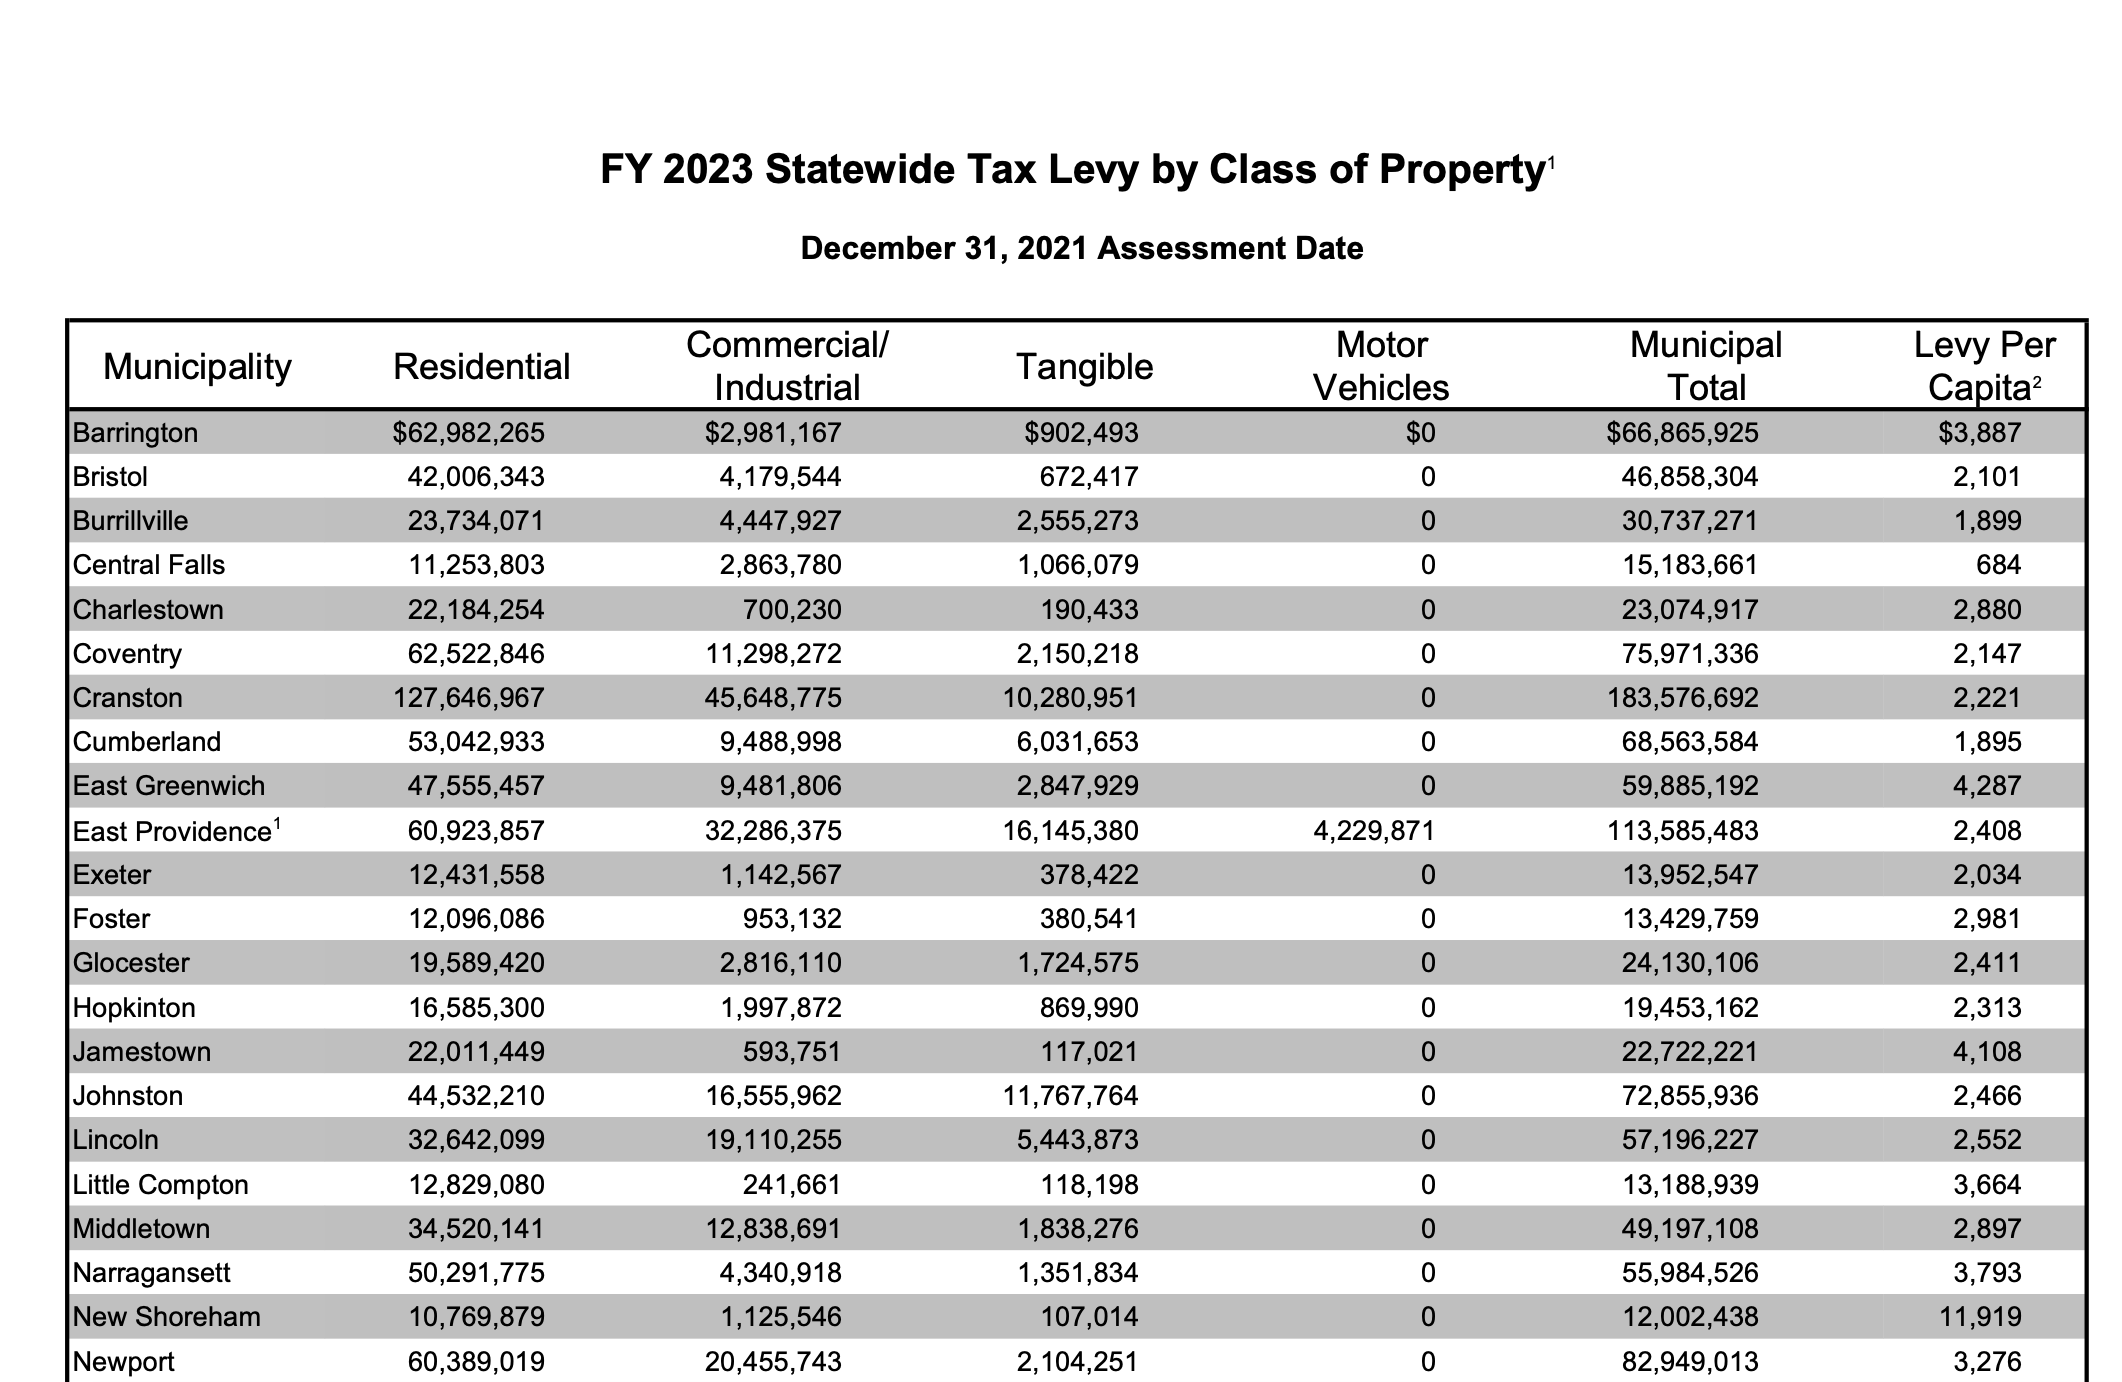
| 2023 | $47,555,457 | $9,481,806 | $2,847,929 | $0 | $59,885,192 | $0 | $59,885,192 |
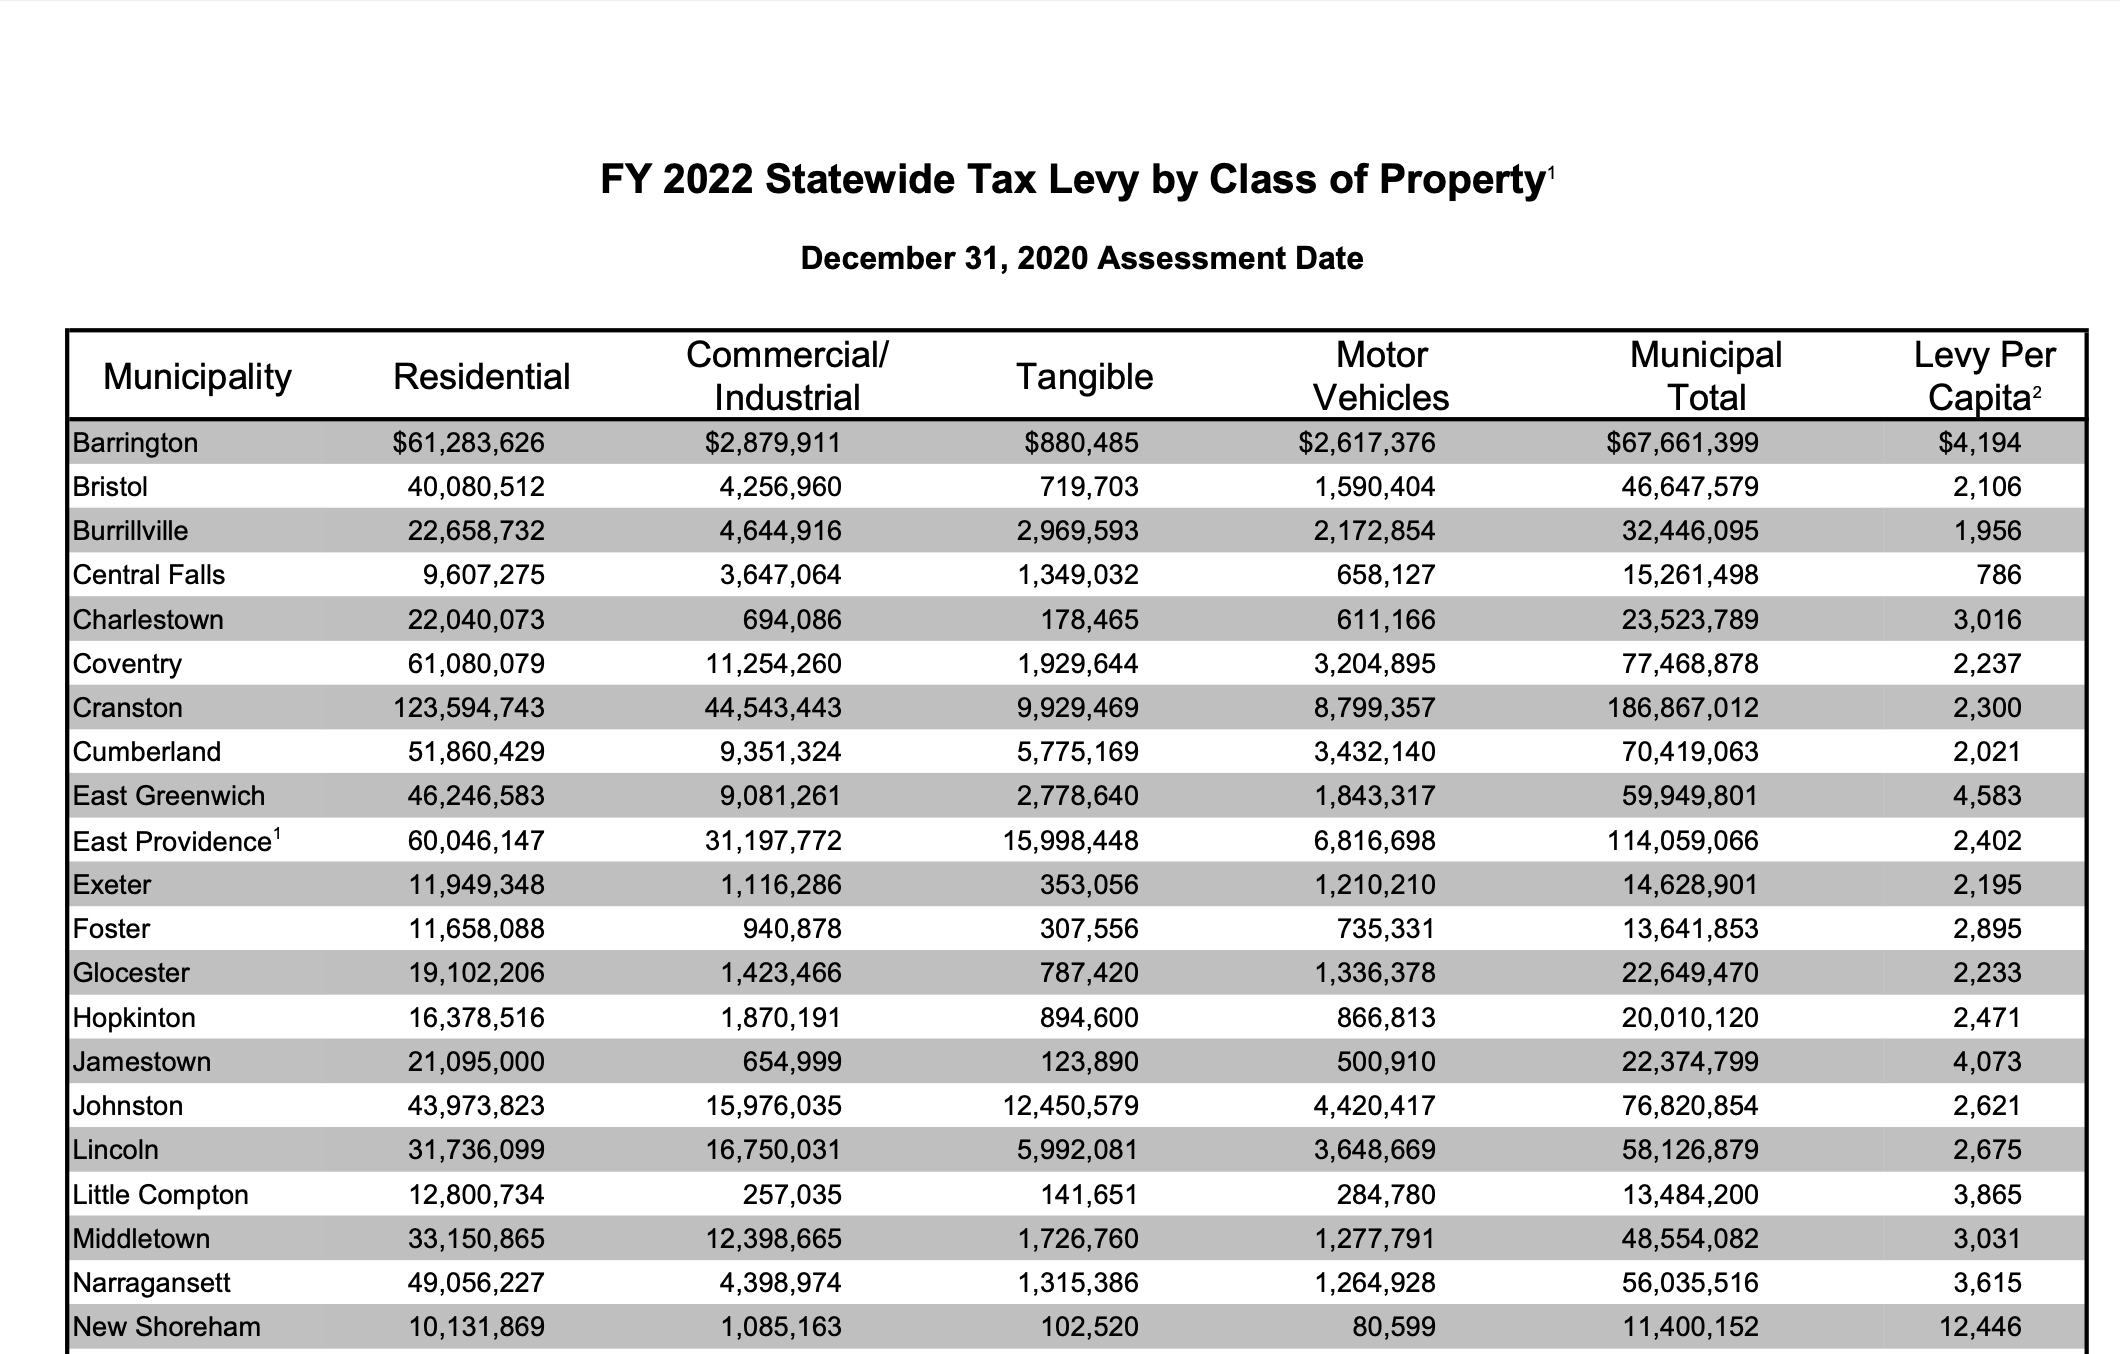
| 2022 | $46,246,583 | $9,081,261 | $2,778,640 | $1,843,317 | $59,949,801 | $0 | $59,949,801 |
| 2021 | $45,656,175 | $8,278,765 | $2,340,174 | $1,658,664 | $57,933,778 | $0 | $57,933,778 |
| 2020 | $45,006,284 | $8,095,127 | $1,886,268 | $1,892,518 | $56,880,197 | $0 | $56,880,197 |
| 2019 | $44,462,455 | $7,742,925 | $1,788,008 | $1,988,520 | $55,981,907 | $0 | $55,981,907 |
| 2018 | $44,685,332 | $7,520,322 | $1,832,569 | $2,131,688 | $56,169,911 | $0 | $56,169,911 |
| 2017 | $45,348,786 | $7,514,025 | $1,860,198 | $2,296,400 | $57,019,409 | $0 | $57,019,409 |
| 2016 | $44,287,782 | $7,192,620 | $1,756,159 | $2,207,241 | $55,443,802 | $0 | $55,443,802 |
| 2015 | $42,434,200 | $7,722,843 | $3,835,295 | $5,337,383 | $53,345,608 | $0 | $53,345,608 |
| 2014 | $40,497,596 | $7,753,516 | $1,438,782 | $2,155,895 | $51,845,789 | $0 | $51,845,789 |
| 2013 | $35,184,469 | $6,786,750 | $1,250,858 | $2,159,050 | $45,381,128 | $4,293,917 | $49,675,045 |
| 2012 | $34,495,142 | $6,503,514 | $1,011,699 | $2,005,496 | $44,015,850 | $4,070,233 | $48,086,083 |
| 2011 | $34,432,569 | $5,804,508 | $1,015,123 | $1,893,170 | $43,145,369 | $4,060,355 | $47,205,724 |
| 2010 | $38,683,194 | $0 | $1,113,204 | $1,727,945 | $41,524,344 | $4,063,744 | $45,588,088 |
| 2009 | $36,678,666 | $0 | $849,641 | $2,048,100 | $39,575,719 | $4,047,972 | $43,623,691 |
| 2008 | $35,012,906 | $0 | $798,199 | $1,913,361 | $37,726,180 | $3,794,238 | $41,520,518 |
| 2007 | $32,626,885 | $0 | $742,267 | $1,940,010 | $35,309,164 | $3,556,219 | $38,865,383 |
| 2006 | $31,846,437 | $0 | $808,585 | $2,036,138 | $34,691,160 | $3,351,209 | $38,042,369 |
| 2005 | $30,159,566 | $0 | $744,899 | $1,838,149 | $32,742,615 | $2,805,045 | $35,547,660 |
| 2004 | $28,383,952 | $0 | $779,245 | $1,871,633 | $31,034,832 | $2,529,042 | $33,563,874 |
| 2003 | $26,253,016 | $0 | $1,062,289 | $1,773,073 | $29,087,640 | $2,316,361 | $31,404,001 |
| 2002 | $25,570,387 | $0 | $994,160 | $1,931,657 | $28,495,352 | $2,135,511 | $30,630,863 |
| 2001 | $21,756,888 | $2,547,585 | $1,029,818 | $1,944,860 | $27,280,262 | $2,125,989 | $29,406,251 |
| 2000 | $21,498,483 | $0 | $1,029,818 | $2,393,850 | $24,831,179 | $2,092,234 | $26,923,413 |
| 1999 | $20,549,044 | $0 | $909,650 | $2,144,695 | $23,601,647 | $1,954,908 | $25,556,555 |
| 1998 | $19,398,393 | $0 | $880,373 | $2,794,198 | $22,193,962 | $1,969,507 | $24,163,469 |
| 1997 | $18,554,222 | $0 | $911,223 | $1,770,701 | $21,236,148 | $1,885,140 | $23,121,288 |
| 1996 | $17,774,975 | $0 | $997,148 | $2,091,833 | $20,863,957 | $1,825,068 | $22,689,025 |
| 1995 | $16,933,312 | $0 | $894,907 | $1,968,679 | $19,857,249 | $1,748,748 | $21,605,997 |
| 1994 | $16,113,939 | $0 | $850,989 | $1,660,867 | $18,625,795 | $1,528,837 | $20,154,632 |
| 1993 | $15,141,908 | $0 | $786,049 | $1,444,170 | $17,372,127 | $1,496,118 | $18,868,245 |
| 1992 | $14,591,408 | $0 | $736,076 | $1,435,531 | $16,763,016 | $1,358,257 | $18,121,363 |
References and Footnotes
| 1 | The property tax levy was obtained from the Town Manager's 2025 proposed budget and the RI Division of Municipal Finance, Department of Revenue Assesed Values and Levies page for fiscal years 2011-2024. Earlier years were obtained from the Tax Roll Recapitulation Page documents filed by the Tax Assessor. |
| 2 | The Fire District levy was obtained from the real estate tax rolls for years when it appeared on them. For other years, the levy was computed by applying the Fire District tax rate obtained from the town clerk to the tax roll account by account, including exemptions. |
| 3 | Town Manager's proposed budget. |