The graph of property tax rates from 2007 to 2016 seems to support the conclusion from the mailer:
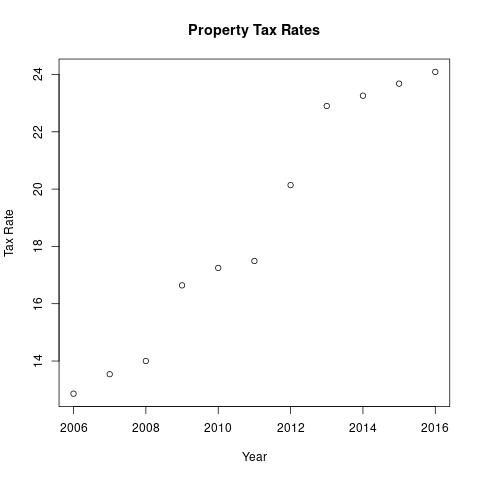

The tax rate falls when property values rise, and rises when they fall, with a time lag of a couple of years due to the revaluation cycle.
The first graph covers a period when overall property values were falling, while the second covers a period when property values were rising.
Operating costs rose during both periods, but the tax rate rose in one period and fell in the other.
We could look at the total amount of property taxes collected (the levy). The problem with this is part of any increase is due to new construction, so costs go up because more services are required. We should not attribute this to the rising costs of delivering services on a per-unit basis.
A long-term plot of East Greenwich property tax rates reveals that the tax rate has been on a gradual downward trend for 70 years, punctuated by wide swings due to the boom-and-bust cycles in the real estate market, or periods of exceptional new construction activity.

So to estimate the rate of growth of operating expenses for existing services, we have to correct for swings in the real estate market and new construction.
The plot of the tax rate over the last six revaluation cycles suggests a way to do this:
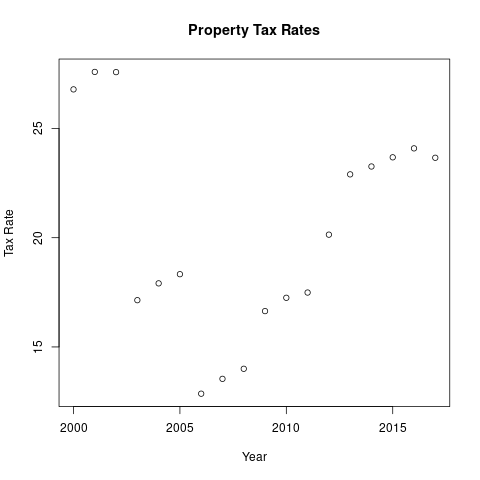
Within a revaluation cycle, most property values do not change, so if the tax rate changes within a revaluation cycle, that change can be attributed mainly to operating expenses.
And because the effects of growth in the tax base are "baked into" the tax rate, we automatically get some asjustment for new construction.
Of course this assumes that the tax rate has been set in a fiscally responsible way (i.e., at a level that will generate enough revenue to cover projected expenses) and not intentionally set too low for political gain (i.e., intentionally set too to cover projected expenses, with the intention of drawing down reserves to cover the anticipated shortfall, to create the appearance of "holding the line" on taxes).
When you use a linear statistical model to estimate the intra-cycle growth rate of operating expenses, you get an estimate of 2.8% annual growth, with no evidence of a spike in recent history.
Based on the $54,038,223 levy excluding car taxes from the RI Municipal Finance website,
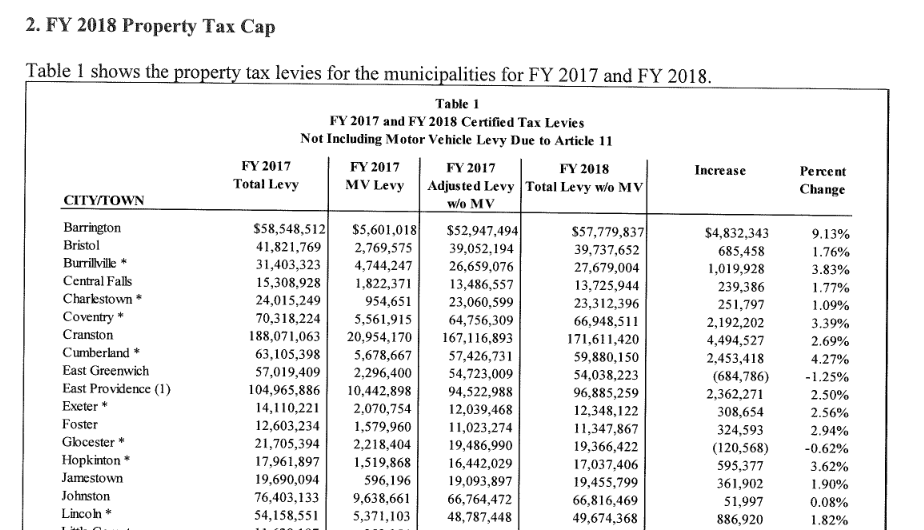
This result suggests that the $1 million the council plans to draw from reserves will not be adequate.
When I was working on the mailer analysis, I recorded this description explaining how it should be possible to estimate the growth in operating expenses using changes in the tax rate within a revaluation cycle: