East Greenwich Tax Rate History


The May 2017 Resident Mailer

fig1 In May 2017, the East Greenwich Town Council sent out a mailer to all residents claiming that property taxes were rising faster than our ability to pay them.

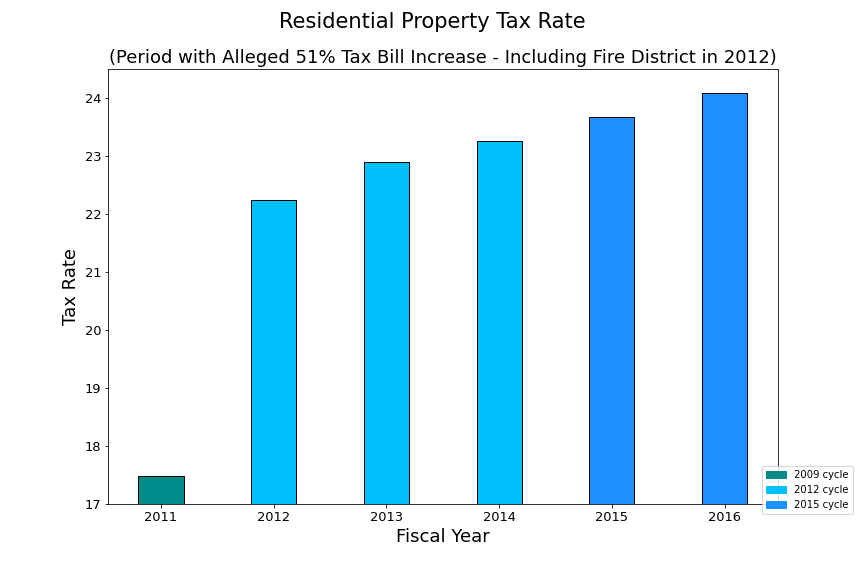
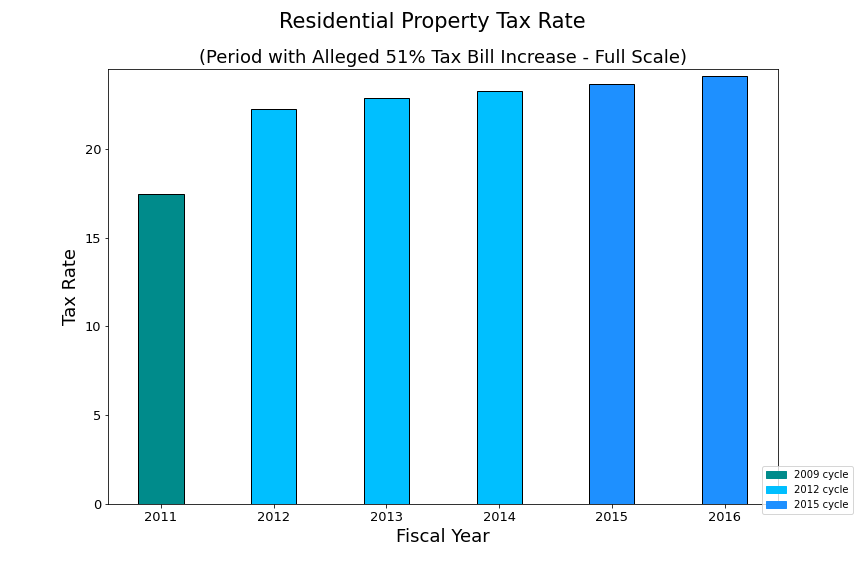
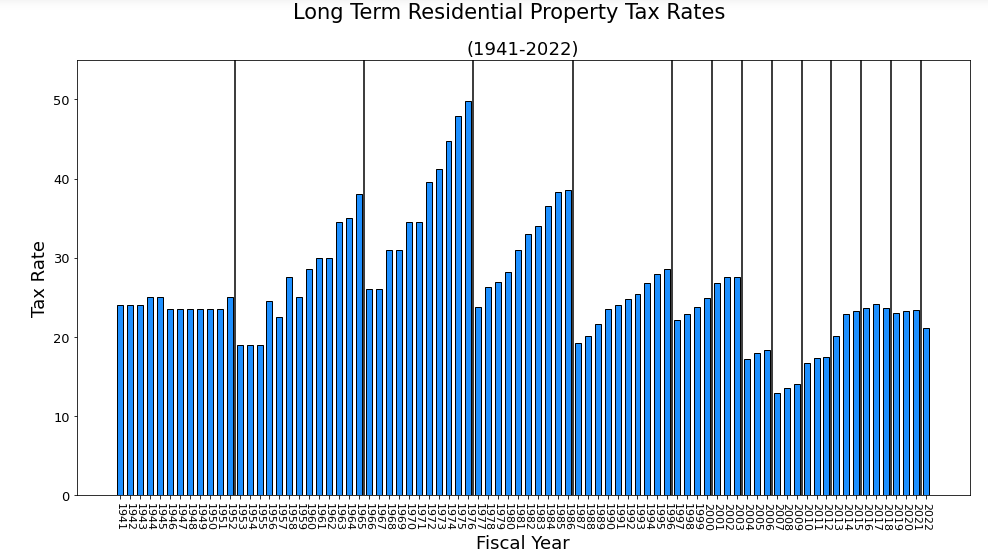
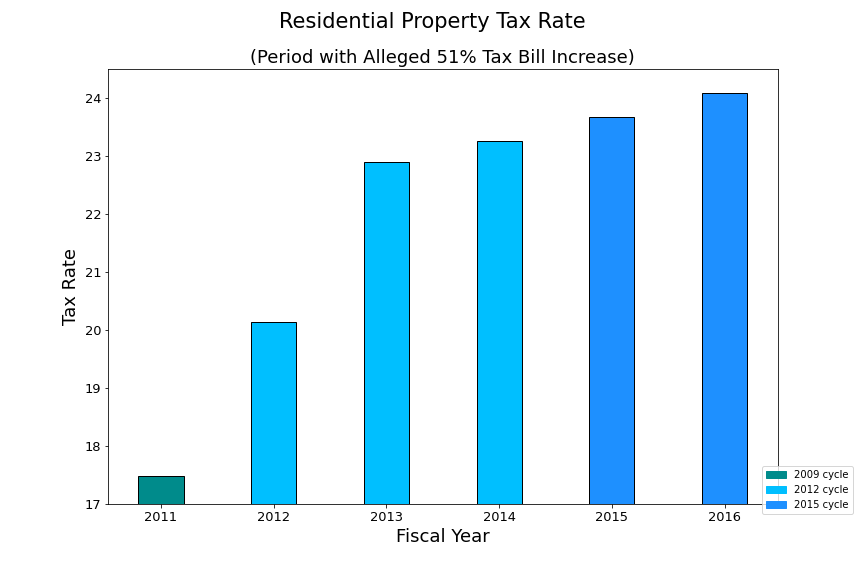
The mailer claimed that over the period from 2011 to 2016, the median property tax bill had risen by 51%, an unsustainable rate.

The actual increase was 14%, but graphs like the one to the left made the 51% number seem plausiible.

There appears to be:

  • A big jump from 2011 to 2012
  • Another from 2012 to 2013
  • Smaller but steady increases in 2014, 2015, and 2016.

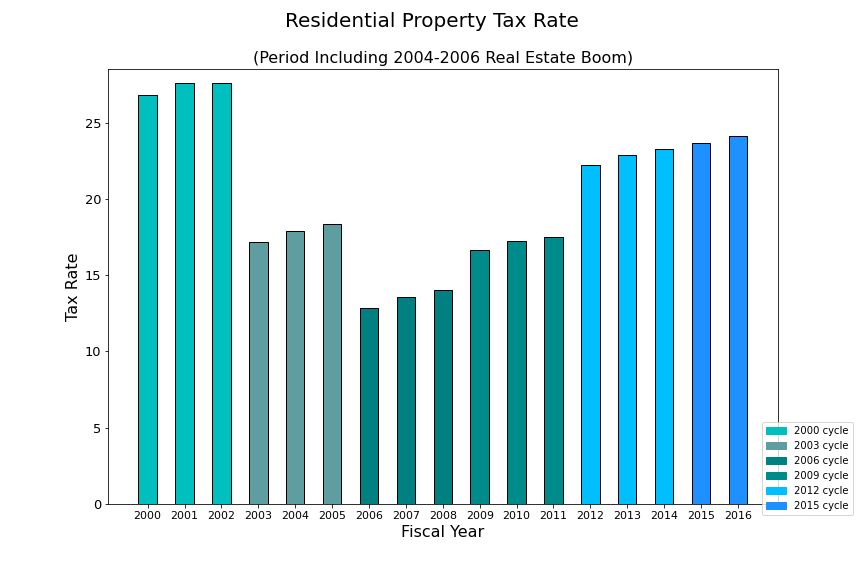
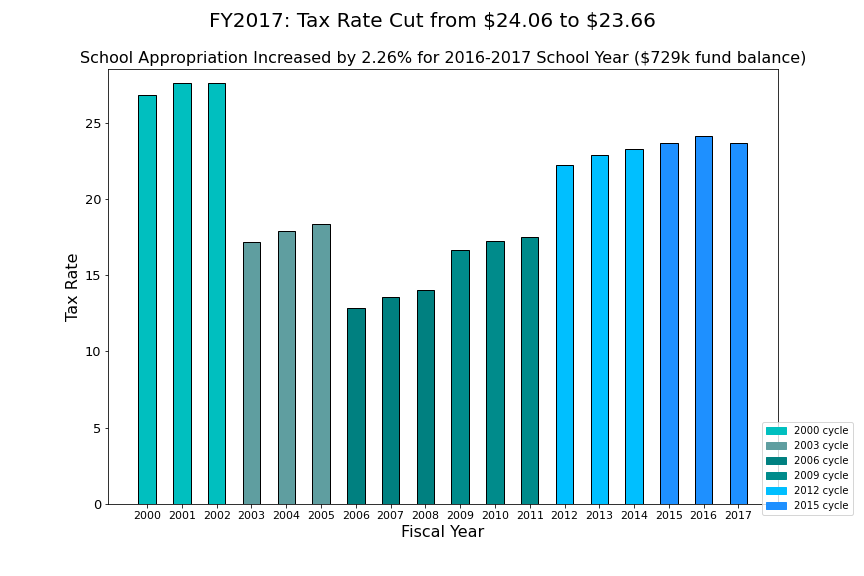
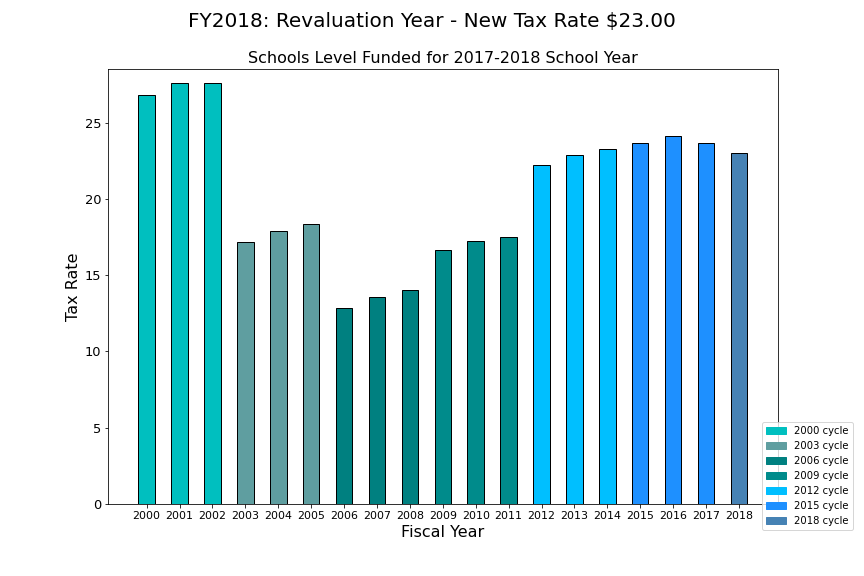
Assessed property values are adjusted in a three year revaluation cycle. The graph is color coded by revaluation cycle.

Explaining the 2012-2013 Jump

fig1 2013 was the first year the Fire Deparment was incorporated into the town.

The 2012 rate did not include the Fire District, but the 2013 rate does include the new Fire Department.

When you adjust the 2012 rate to include the Fire District, the increase in 2013 no longer appears to be abnormally large.

The change from 2012 to 2013 still appears to be very large.

The 2011-2012 Jump - Making the Bars Proportional to the Rates

fig1 When the chart is adjusted so that the length of the bars is proportional to the rate, the 2011-2012 change does not apper quite so large.

Note that it is the only bar on this graph in the 2009 revaluation cycle.

Let's examine the full 2009 cycle and others.

Examining Effect of Revaluation Cycles

fig1 Expanding the chart back to 2000 reveals the patterns of variation in the tax rate:
  • Within a rating cycle, there is usually a small increase from year to year.
  • Large changes in the tax rate occur only at revaluation cycle boundaries. These reflect changes in the real estate market, not changes in operating expenses.

  • During the 2005-2006 real estate bubble, property values nearly doubled. As a result, the tax rate was cut in half between 2002 and 2006.
  • Operating expenses rose every year during this period.

The 2017 Rate Cut

fig1 The pattern of steady increases within a revaluation cycle was interrupted in 2017.

A fairly typical 2.26% increase in school funding was mostly paid for by a transfer from the school fund balance.

A small tax rate cut, unusual within a revaluation cycle, was enacted, even though operating expenses increased.

2018: Level Funding the Schools

fig1 In 2018 the Town Council level-funded the schools, meaning the appropriation was the same as the previous year.

By law, the appropriation cannot be less than the previous year, so this was the minimum allowed.

The school department had no choice but to implement some very damaging cuts:

  • East Greenwich became the only public school district in the state without a librarian at the high school. The accreditation body took notice of this and advised the district to remedy the situation.
  • Popular activities such a chorus had to be eliminated. In some cases these continued with unfunded student volunteer leadership.
  • A performance audit the following year stated that the district was $1.2 million dollars below the minimum required to meet its statutory requirements.

2019: Restoration

fig1 After the 2018 election, the new Town Council quickly took action in the form of a supplemental appropriation to the schools.

That year the appropriation was increased by 3.89%, very close to the statutory cap of 4%.

Note the heights of the 2018 and 2019 bars:

  • The 2018 bar represents a year with the minimum appropriation allowed by law.

  • The 2019 bar represents a year with very close to the maximum appropriation allowed by law.

Conclusion: It is not possible to significantly change the tax rate by adjusting the school appropriation within the ranges allowed by law.

Current and Proposed Rates

fig1 The two bars for 2021 represent the Superintendent's and Town Manager's proposals as of 6/1/2021.

The Town Council will decide on the final appropriations and tax rate in early June, so these may change a bit.

The 80 Year Record

fig1 Despite some wild gyrations, the residential property tax rate is essentially where it was 80 years ago in 1941.

  • A $23 per thousand tax rate means we pay 2.3% of our property value per year.
  • Big changes in the tax rate are driven by the real estate market, not expenses.
  • Differences between communities are mostly due to differences in the size of the tax base, not efficiency.